NASCAR Class A
2017 Season 1
- 1,497 unique drivers averaging 7.21 starts each.
- 141 drivers raced in 8 or more weeks.
- 550 official races with an average SOF of 2,668.
- 738,538 laps were completed with 32,450 incidents.
Week 1
Talladega Superspeedway
- Total official races: 77
- Total drivers: 1,529
- Unique drivers: 526
- Highest SoF: 4,434
- Average SoF: 2,366
| # |
groupid |
Driver |
Car |
Points |
| 1 |
150878 |
Robbie Vrabel Jr |
CSS |
254 |
| 2 |
41210 |
Brad Patton |
TC |
243 |
| 3 |
215936 |
Dustin L Johnson |
TC |
236 |
Week 2
Chicagoland Speedway
- Total official races: 31
- Total drivers: 608
- Unique drivers: 258
- Highest SoF: 3,922
- Average SoF: 2,659
| # |
groupid |
Driver |
Car |
Points |
| 1 |
115041 |
Nathan Wise |
CSS |
222 |
| 2 |
20911 |
Kwame Adjei |
CSS |
218 |
| 3 |
174060 |
Colton Davis |
CSS |
215 |
Week 3
Auto Club Speedway
Oval
- Total official races: 44
- Total drivers: 853
- Unique drivers: 302
- Highest SoF: 4,866
- Average SoF: 2,695
| # |
groupid |
Driver |
Car |
Points |
| 1 |
105479 |
Taylor Hurst |
CSS |
272 |
| 2 |
118122 |
Jimmy Mullis |
CSS |
260 |
| 3 |
173213 |
Garrett Lowe |
CSS |
248 |
- Total official races: 32
- Total drivers: 593
- Unique drivers: 241
- Highest SoF: 4,444
- Average SoF: 2,846
| # |
groupid |
Driver |
Car |
Points |
| 1 |
87205 |
Zack Novak |
TC |
245 |
| 2 |
105479 |
Taylor Hurst |
CSS |
237 |
| 3 |
87660 |
Ethan Lane |
TC |
236 |
Week 5
Rockingham Speedway
Oval
- Total official races: 14
- Total drivers: 267
- Unique drivers: 114
- Highest SoF: 3,299
- Average SoF: 2,724
| # |
groupid |
Driver |
Car |
Points |
| 1 |
35432 |
Todd Hendrick |
CSS |
167 |
| 2 |
43783 |
Chris Westerfield |
CSS |
164 |
| 3 |
138937 |
William Hale |
CSS |
159 |
Week 6
Iowa Speedway
Oval
- Total official races: 15
- Total drivers: 293
- Unique drivers: 126
- Highest SoF: 3,241
- Average SoF: 2,660
| # |
groupid |
Driver |
Car |
Points |
| 1 |
46022 |
Craig Stykes |
CSS |
163 |
| 2 |
109161 |
John A. Schulte |
CSS |
162 |
| 3 |
251202 |
Alex McCollum3 |
TC |
160 |
Week 7
[Legacy] Texas Motor Speedway - 2009
Oval
- Total official races: 42
- Total drivers: 762
- Unique drivers: 283
- Highest SoF: 4,459
- Average SoF: 2,865
| # |
groupid |
Driver |
Car |
Points |
| 1 |
173213 |
Garrett Lowe |
CSS |
251 |
| 2 |
105479 |
Taylor Hurst |
CSS |
241 |
| 3 |
132004 |
Adam Benefiel |
CSS |
241 |
Week 8
[Legacy] Charlotte Motor Speedway - 2008
Oval
- Total official races: 42
- Total drivers: 789
- Unique drivers: 270
- Highest SoF: 4,696
- Average SoF: 2,926
| # |
groupid |
Driver |
Car |
Points |
| 1 |
150878 |
Robbie Vrabel Jr |
CSS |
260 |
| 2 |
28756 |
Jeff Hollingsworth |
FF |
255 |
| 3 |
105479 |
Taylor Hurst |
CSS |
250 |
Week 9
[Legacy] Michigan International Speedway - 2009
- Total official races: 40
- Total drivers: 848
- Unique drivers: 297
- Highest SoF: 5,615
- Average SoF: 3,027
| # |
groupid |
Driver |
Car |
Points |
| 1 |
118122 |
Jimmy Mullis |
CSS |
302 |
| 2 |
173213 |
Garrett Lowe |
CSS |
288 |
| 3 |
15780 |
Brian Schoenburg |
CSS |
274 |
Week 10
Phoenix Raceway
Oval w/open dogleg
- Total official races: 37
- Total drivers: 672
- Unique drivers: 270
- Highest SoF: 6,180
- Average SoF: 3,025
| # |
groupid |
Driver |
Car |
Points |
| 1 |
173213 |
Garrett Lowe |
CSS |
327 |
| 2 |
251202 |
Alex McCollum3 |
CSS |
310 |
| 3 |
105479 |
Taylor Hurst |
CSS |
294 |
Week 11
Daytona International Speedway
Oval
- Total official races: 111
- Total drivers: 2,418
- Unique drivers: 896
- Highest SoF: 6,292
- Average SoF: 2,479
| # |
groupid |
Driver |
Car |
Points |
| 1 |
119681 |
Logan Clampitt |
CSS |
346 |
| 2 |
58489 |
Dylan Duval |
CSS |
332 |
| 3 |
105479 |
Taylor Hurst |
CSS |
319 |
Week 12
Atlanta Motor Speedway
Oval
- Total official races: 65
- Total drivers: 1,162
- Unique drivers: 436
- Highest SoF: 4,514
- Average SoF: 2,518
| # |
groupid |
Driver |
Car |
Points |
| 1 |
35432 |
Todd Hendrick |
CSS |
262 |
| 2 |
23913 |
Robert Perles |
CSS |
251 |
| 3 |
62419 |
Malik Ray |
CSS |
247 |
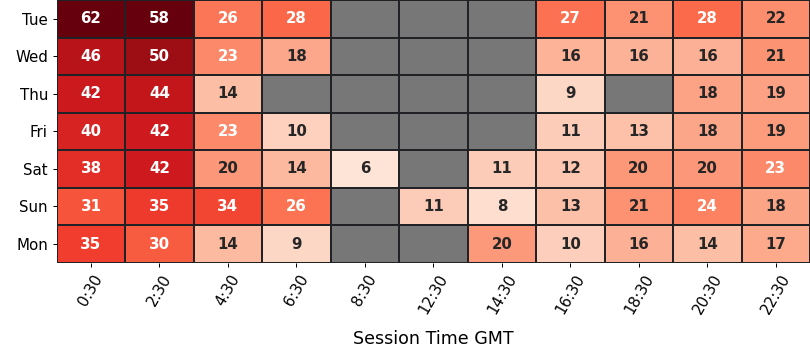
Participation
average number of drivers in each time slot
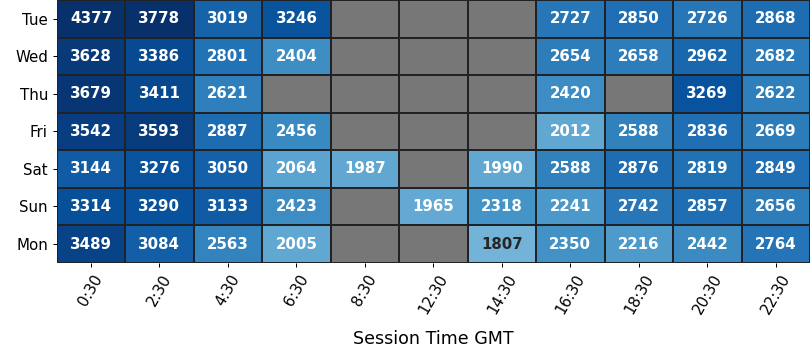
Strength of Field
average SoF of the top split for each time slot
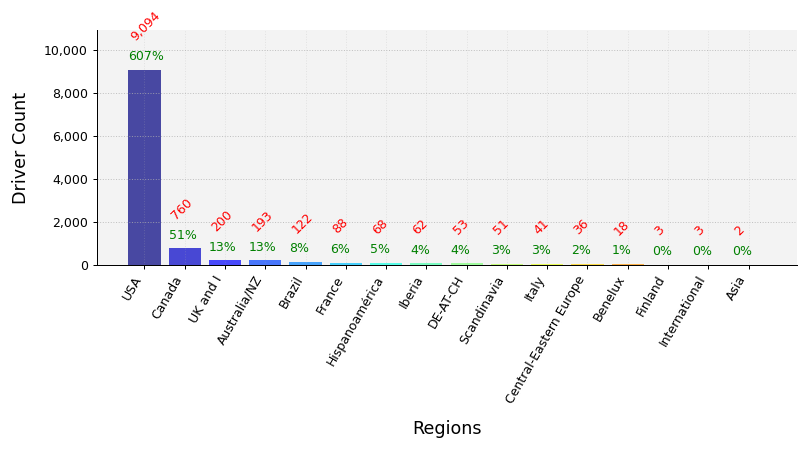
Clubs Distribution
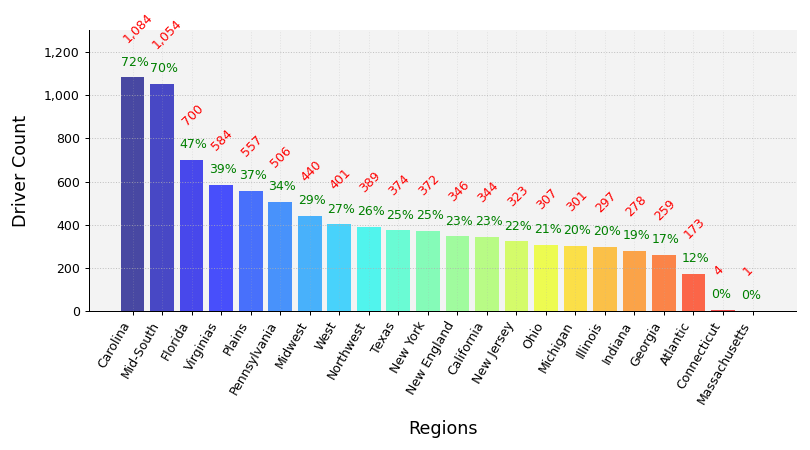
USA Clubs Distribution
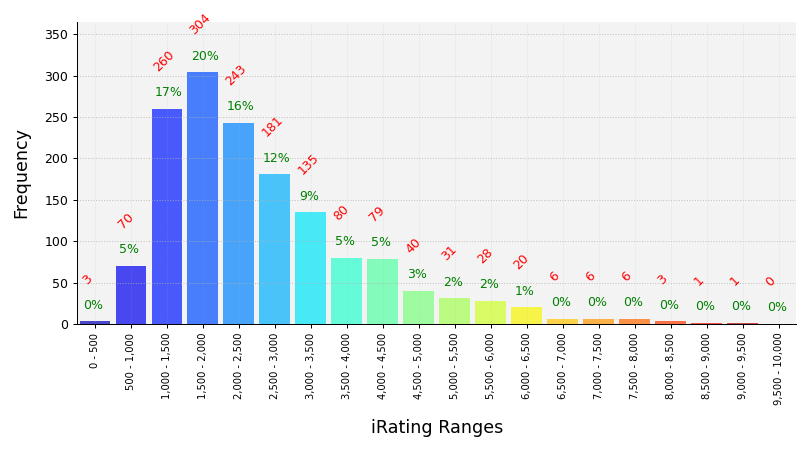
iRating Distribution
Championship Points
| # |
groupid |
Driver |
Car |
Points |
| 1 |
173213 |
Garrett Lowe |
CSS |
1,969 |
| 2 |
105479 |
Taylor Hurst |
CSS |
1,870 |
| 3 |
118122 |
Jimmy Mullis |
CSS |
1,864 |
| 4 |
150878 |
Robbie Vrabel Jr |
CSS |
1,737 |
| 5 |
28756 |
Jeff Hollingsworth |
FF |
1,736 |
Most Race Starts
| # |
groupid |
Driver |
Car |
Starts |
| 1 |
35017 |
Maxx Harris |
FF |
159 |
| 2 |
24688 |
Howard Bell |
CSS |
137 |
| 3 |
75527 |
William Vandiver |
FF |
132 |
| 4 |
24789 |
Jonathan Dickert |
CSS |
104 |
| 5 |
186309 |
Ron Walsh |
TC |
94 |
Grand Chelems
pole position, won race, fastest lap, led every lap (perfect if 0 inc)
| # |
groupid |
Driver |
Car |
Grand Chelems |
Chelem % |
Perfects |
| 1 |
110292 |
Dave Siltman Sr |
CSS |
3 |
14% |
3 |
| 2 |
139327 |
Shawn Powell |
CSS |
3 |
12% |
3 |
| 3 |
29928 |
Chad Pruitt |
CSS |
3 |
10% |
3 |
| 4 |
83682 |
David Lam |
CSS |
3 |
4% |
3 |
| 5 |
68739 |
Ryan Lowe |
CSS |
2 |
40% |
2 |
Average Finish Position
drivers must have raced 8 or more weeks to feature in this table
| # |
groupid |
Driver |
Car |
Avg Finish Pos |
Races |
| 1 |
150878 |
Robbie Vrabel Jr |
CSS |
3.4 |
14 |
| 2 |
16647 |
Nicholas Morse |
CSS |
3.6 |
29 |
| 3 |
29928 |
Chad Pruitt |
CSS |
3.8 |
31 |
| 4 |
54851 |
Bill Brown |
CSS |
4.2 |
9 |
| 5 |
105479 |
Taylor Hurst |
CSS |
4.7 |
15 |
Most Wins
| # |
groupid |
Driver |
Car |
Wins |
| 1 |
16647 |
Nicholas Morse |
CSS |
17 |
| 2 |
83682 |
David Lam |
CSS |
12 |
| 3 |
123105 |
Kemonric Little2 |
TC |
12 |
| 4 |
29928 |
Chad Pruitt |
CSS |
11 |
| 5 |
35017 |
Maxx Harris |
FF |
11 |
Most Podiums
| # |
groupid |
Driver |
Car |
Podiums |
| 1 |
35017 |
Maxx Harris |
FF |
35 |
| 2 |
83682 |
David Lam |
CSS |
31 |
| 3 |
16647 |
Nicholas Morse |
CSS |
24 |
| 4 |
123105 |
Kemonric Little2 |
TC |
24 |
| 5 |
111238 |
Dalton Collins |
CSS |
23 |
Most Poles
| # |
groupid |
Driver |
Car |
Poles |
| 1 |
144291 |
Keith Stewart |
FF |
12 |
| 2 |
185351 |
Brad Neer |
FF |
10 |
| 3 |
29584 |
Gabriel Solis |
TC |
9 |
| 4 |
111941 |
Chuck Sweeting |
TC |
9 |
| 5 |
111238 |
Dalton Collins |
CSS |
9 |
Best Win Percentage
drivers must have raced 8 or more weeks to feature in this table
| # |
groupid |
Driver |
Car |
Win % |
Races |
| 1 |
16647 |
Nicholas Morse |
CSS |
59% |
29 |
| 2 |
173213 |
Garrett Lowe |
CSS |
40% |
15 |
| 3 |
105479 |
Taylor Hurst |
CSS |
40% |
15 |
| 4 |
150878 |
Robbie Vrabel Jr |
CSS |
36% |
14 |
| 5 |
29928 |
Chad Pruitt |
CSS |
35% |
31 |
Best Podium Percentage
drivers must have raced 8 or more weeks to feature in this table
| # |
groupid |
Driver |
Car |
Podium % |
Races |
| 1 |
16647 |
Nicholas Morse |
CSS |
83% |
29 |
| 2 |
173213 |
Garrett Lowe |
CSS |
73% |
15 |
| 3 |
105479 |
Taylor Hurst |
CSS |
73% |
15 |
| 4 |
150878 |
Robbie Vrabel Jr |
CSS |
64% |
14 |
| 5 |
29928 |
Chad Pruitt |
CSS |
61% |
31 |
Best Pole Percentage
drivers must have raced 8 or more weeks to feature in this table
| # |
groupid |
Driver |
Car |
Pole % |
Races |
| 1 |
110292 |
Dave Siltman Sr |
CSS |
33% |
21 |
| 2 |
173213 |
Garrett Lowe |
CSS |
33% |
15 |
| 3 |
54851 |
Bill Brown |
CSS |
33% |
9 |
| 4 |
16549 |
Arron Maspero |
CSS |
30% |
10 |
| 5 |
139327 |
Shawn Powell |
CSS |
27% |
26 |
Best Average iRating Gains
drivers must have raced 8 or more weeks to feature in this table
| # |
groupid |
Team |
Car |
Avg iRating +/- |
Races |
| 1 |
150878 |
Robbie Vrabel Jr |
CSS |
32 |
14 |
| 2 |
29928 |
Chad Pruitt |
CSS |
32 |
31 |
| 3 |
110292 |
Dave Siltman Sr |
CSS |
28 |
21 |
| 4 |
16647 |
Nicholas Morse |
CSS |
26 |
29 |
| 5 |
78710 |
William Amshoff |
CSS |
22 |
33 |
Highest Total iRating Gains
| # |
groupid |
Team |
Car |
iRating +/- |
Races |
| 1 |
29928 |
Chad Pruitt |
CSS |
990 |
31 |
| 2 |
123648 |
Everett F Lane |
CSS |
915 |
22 |
| 3 |
46537 |
Gregory McKnight |
FF |
869 |
61 |
| 4 |
32656 |
Raymond R Barcomb |
FF |
777 |
73 |
| 5 |
16647 |
Nicholas Morse |
CSS |
752 |
29 |
Cleanest Drivers
drivers must have raced 8 or more weeks to feature in this table
| # |
groupid |
Driver |
Car |
Inc / Corner |
| 1 |
54851 |
Bill Brown |
CSS |
0.001 |
| 2 |
131973 |
Robert Ehrling |
FF |
0.003 |
| 3 |
43783 |
Chris Westerfield |
CSS |
0.003 |
| 4 |
16647 |
Nicholas Morse |
CSS |
0.003 |
| 5 |
16549 |
Arron Maspero |
CSS |
0.004 |