Street Stock Series - C
2017 Season 1
- 2,554 unique drivers averaging 6.38 starts each.
- 176 drivers raced in 8 or more weeks.
- 1,046 official races with an average SOF of 1,893.
- 676,388 laps were completed with 75,998 incidents.
Week 1
South Boston Speedway
- Total official races: 100
- Total drivers: 1,578
- Unique drivers: 646
- Highest SoF: 3,655
- Average SoF: 1,956
| # |
groupid |
Driver |
Points |
| 1 |
37263 |
Kyle J Donahue |
187 |
| 2 |
54614 |
Bryan Narducci |
186 |
| 3 |
79897 |
Mike Christopher Jr |
185 |
Week 2
Bristol Motor Speedway
Dual Pit Roads
- Total official races: 93
- Total drivers: 1,477
- Unique drivers: 638
- Highest SoF: 3,294
- Average SoF: 1,808
| # |
groupid |
Driver |
Points |
| 1 |
172758 |
Jacob Nottestad |
177 |
| 2 |
221992 |
Joshua Ayer |
171 |
| 3 |
140820 |
Derek Kraus |
169 |
Week 3
Rockingham Speedway
Oval
- Total official races: 78
- Total drivers: 1,082
- Unique drivers: 431
- Highest SoF: 3,347
- Average SoF: 1,925
| # |
groupid |
Driver |
Points |
| 1 |
112242 |
Corey Heim |
171 |
| 2 |
166376 |
Collin Slife |
160 |
| 3 |
90854 |
Jake Matheson |
159 |
- Total official races: 98
- Total drivers: 1,460
- Unique drivers: 594
- Highest SoF: 3,789
- Average SoF: 1,768
| # |
groupid |
Driver |
Points |
| 1 |
121001 |
Alex Crapser |
215 |
| 2 |
107777 |
Ryan Kuhn |
205 |
| 3 |
85546 |
Parker Traves |
204 |
Week 5
Southern National Motorsports Park
- Total official races: 54
- Total drivers: 756
- Unique drivers: 301
- Highest SoF: 3,878
- Average SoF: 2,064
| # |
groupid |
Driver |
Points |
| 1 |
79897 |
Mike Christopher Jr |
186 |
| 2 |
121001 |
Alex Crapser |
181 |
| 3 |
169102 |
James M Linkiewicz |
179 |
Week 6
Thompson Speedway Motorsports Park
Oval
- Total official races: 85
- Total drivers: 1,339
- Unique drivers: 556
- Highest SoF: 3,626
- Average SoF: 1,807
| # |
groupid |
Driver |
Points |
| 1 |
120041 |
Jackson Lewis |
179 |
| 2 |
217829 |
Daniel Wise |
178 |
| 3 |
33628 |
Paul Kusheba |
173 |
Week 7
[Legacy] Phoenix Raceway - 2008
Oval
- Total official races: 134
- Total drivers: 2,138
- Unique drivers: 749
- Highest SoF: 3,879
- Average SoF: 1,824
| # |
groupid |
Driver |
Points |
| 1 |
143103 |
Ryan Doucette |
212 |
| 2 |
79897 |
Mike Christopher Jr |
206 |
| 3 |
121001 |
Alex Crapser |
198 |
Week 8
Five Flags Speedway
- Total official races: 75
- Total drivers: 1,172
- Unique drivers: 410
- Highest SoF: 3,738
- Average SoF: 1,930
| # |
groupid |
Driver |
Points |
| 1 |
173787 |
Riley Stenjem |
204 |
| 2 |
136849 |
Jordan Wesley |
186 |
| 3 |
37062 |
Kevin J Myers |
175 |
Week 9
Lanier National Speedway
Asphalt
- Total official races: 96
- Total drivers: 1,592
- Unique drivers: 602
- Highest SoF: 3,897
- Average SoF: 2,015
| # |
groupid |
Driver |
Points |
| 1 |
172758 |
Jacob Nottestad |
184 |
| 2 |
121001 |
Alex Crapser |
184 |
| 3 |
64155 |
Jason Hogan |
183 |
Week 10
New Smyrna Speedway
- Total official races: 55
- Total drivers: 852
- Unique drivers: 368
- Highest SoF: 3,778
- Average SoF: 1,934
| # |
groupid |
Driver |
Points |
| 1 |
120041 |
Jackson Lewis |
197 |
| 2 |
184802 |
David Kalb |
173 |
| 3 |
109076 |
Matt Kocher |
172 |
Week 11
Martinsville Speedway
- Total official races: 62
- Total drivers: 908
- Unique drivers: 420
- Highest SoF: 3,826
- Average SoF: 2,037
| # |
groupid |
Driver |
Points |
| 1 |
150062 |
Matt Clifton |
210 |
| 2 |
173787 |
Riley Stenjem |
208 |
| 3 |
121001 |
Alex Crapser |
197 |
Week 12
USA International Speedway
Asphalt
- Total official races: 116
- Total drivers: 1,947
- Unique drivers: 785
- Highest SoF: 3,776
- Average SoF: 1,836
| # |
groupid |
Driver |
Points |
| 1 |
143103 |
Ryan Doucette |
191 |
| 2 |
79897 |
Mike Christopher Jr |
183 |
| 3 |
261989 |
Tyler D. Hudson |
178 |
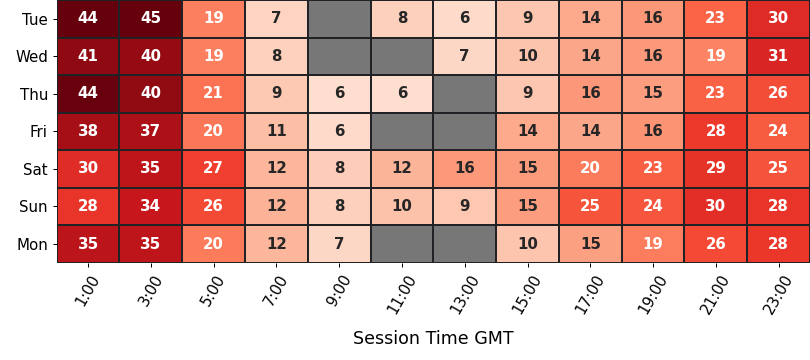
Participation
average number of drivers in each time slot
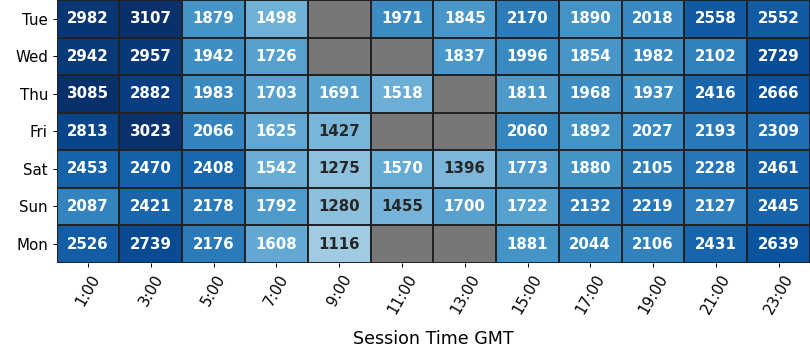
Strength of Field
average SoF of the top split for each time slot
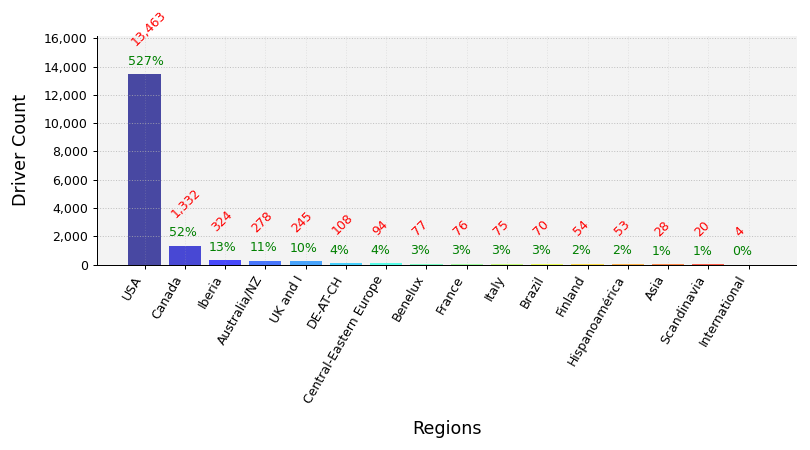
Clubs Distribution
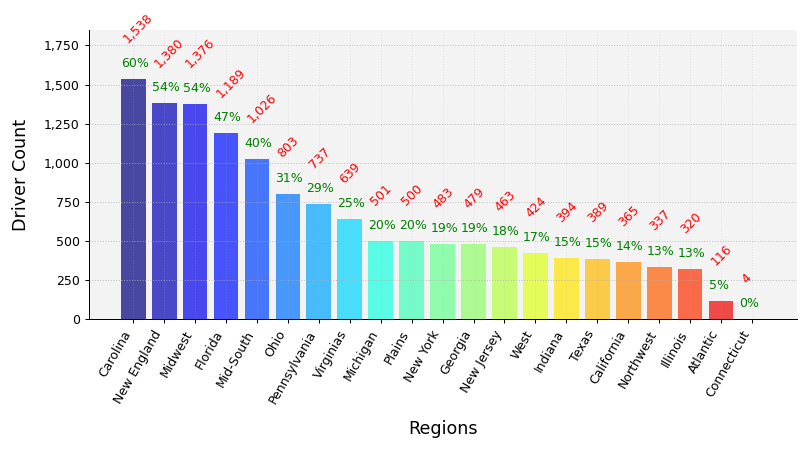
USA Clubs Distribution
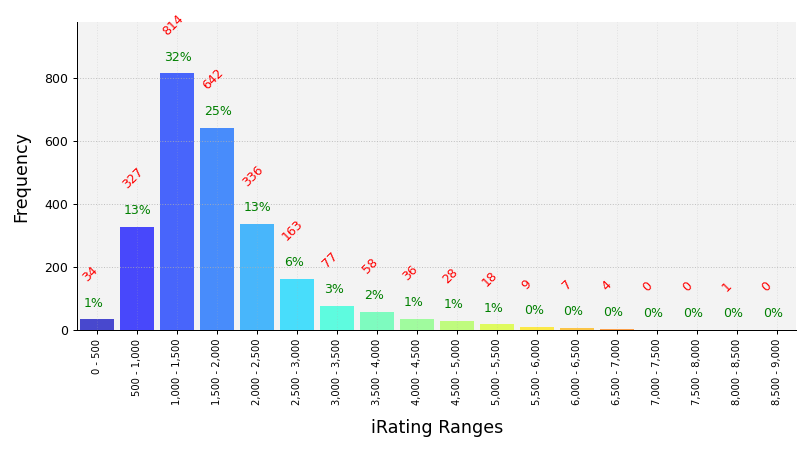
iRating Distribution
Championship Points
| # |
groupid |
Driver |
Points |
| 1 |
121001 |
Alex Crapser |
1,477 |
| 2 |
173787 |
Riley Stenjem |
1,476 |
| 3 |
79897 |
Mike Christopher Jr |
1,374 |
| 4 |
172758 |
Jacob Nottestad |
1,368 |
| 5 |
183717 |
Garret Strachota |
1,347 |
Most Race Starts
| # |
groupid |
Driver |
Starts |
| 1 |
222808 |
Brian Billingsley |
192 |
| 2 |
184802 |
David Kalb |
129 |
| 3 |
58710 |
Jason Miller2 |
120 |
| 4 |
18763 |
Brad Adamson |
115 |
| 5 |
181560 |
Eddie McCarthy |
100 |
Grand Chelems
pole position, won race, fastest lap, led every lap (perfect if 0 inc)
| # |
groupid |
Driver |
Grand Chelems |
Chelem % |
Perfects |
| 1 |
183717 |
Garret Strachota |
10 |
10% |
9 |
| 2 |
173787 |
Riley Stenjem |
6 |
10% |
4 |
| 3 |
87513 |
OJ Dompier |
5 |
28% |
5 |
| 4 |
107777 |
Ryan Kuhn |
5 |
16% |
5 |
| 5 |
121001 |
Alex Crapser |
5 |
11% |
4 |
Average Finish Position
drivers must have raced 8 or more weeks to feature in this table
| # |
groupid |
Driver |
Avg Finish Pos |
Races |
| 1 |
98759 |
Dustin Herröder |
2.4 |
9 |
| 2 |
143103 |
Ryan Doucette |
2.6 |
35 |
| 3 |
121001 |
Alex Crapser |
2.9 |
37 |
| 4 |
107777 |
Ryan Kuhn |
3.0 |
31 |
| 5 |
183717 |
Garret Strachota |
3.2 |
89 |
Most Wins
| # |
groupid |
Driver |
Wins |
| 1 |
183717 |
Garret Strachota |
40 |
| 2 |
120041 |
Jackson Lewis |
24 |
| 3 |
166376 |
Collin Slife |
20 |
| 4 |
103257 |
Donald Etcher |
17 |
| 5 |
241732 |
Dylan McNichol |
16 |
Most Podiums
| # |
groupid |
Driver |
Podiums |
| 1 |
183717 |
Garret Strachota |
67 |
| 2 |
184802 |
David Kalb |
54 |
| 3 |
120041 |
Jackson Lewis |
48 |
| 4 |
254308 |
Thomas Hailey |
35 |
| 5 |
103257 |
Donald Etcher |
33 |
Most Poles
| # |
groupid |
Driver |
Poles |
| 1 |
103257 |
Donald Etcher |
41 |
| 2 |
254308 |
Thomas Hailey |
23 |
| 3 |
183717 |
Garret Strachota |
22 |
| 4 |
58617 |
Matt McCormick |
19 |
| 5 |
121001 |
Alex Crapser |
18 |
Best Win Percentage
drivers must have raced 8 or more weeks to feature in this table
| # |
groupid |
Driver |
Win % |
Races |
| 1 |
107777 |
Ryan Kuhn |
48% |
31 |
| 2 |
172758 |
Jacob Nottestad |
47% |
30 |
| 3 |
183717 |
Garret Strachota |
45% |
89 |
| 4 |
166376 |
Collin Slife |
41% |
49 |
| 5 |
143103 |
Ryan Doucette |
37% |
35 |
Best Podium Percentage
drivers must have raced 8 or more weeks to feature in this table
| # |
groupid |
Driver |
Podium % |
Races |
| 1 |
98759 |
Dustin Herröder |
89% |
9 |
| 2 |
87513 |
OJ Dompier |
78% |
18 |
| 3 |
107777 |
Ryan Kuhn |
77% |
31 |
| 4 |
121001 |
Alex Crapser |
76% |
37 |
| 5 |
183717 |
Garret Strachota |
75% |
89 |
Best Pole Percentage
drivers must have raced 8 or more weeks to feature in this table
| # |
groupid |
Driver |
Pole % |
Races |
| 1 |
103257 |
Donald Etcher |
54% |
76 |
| 2 |
121001 |
Alex Crapser |
49% |
37 |
| 3 |
148345 |
Layne Riggs |
42% |
26 |
| 4 |
106972 |
Dale Shaw |
41% |
17 |
| 5 |
231443 |
Camron Ray |
40% |
15 |
Best Average iRating Gains
drivers must have raced 8 or more weeks to feature in this table
| # |
groupid |
Team |
Avg iRating +/- |
Races |
| 1 |
151456 |
Kevin Flynn |
34 |
11 |
| 2 |
252259 |
Chet Bos |
30 |
13 |
| 3 |
166376 |
Collin Slife |
29 |
49 |
| 4 |
200160 |
Seth Rawls |
29 |
9 |
| 5 |
53873 |
Eric Oswald |
28 |
11 |
Highest Total iRating Gains
| # |
groupid |
Team |
iRating +/- |
Races |
| 1 |
254308 |
Thomas Hailey |
1,932 |
86 |
| 2 |
120041 |
Jackson Lewis |
1,677 |
91 |
| 3 |
166376 |
Collin Slife |
1,413 |
49 |
| 4 |
241732 |
Dylan McNichol |
1,407 |
88 |
| 5 |
58710 |
Jason Miller2 |
1,359 |
120 |
Cleanest Drivers
drivers must have raced 8 or more weeks to feature in this table
| # |
groupid |
Driver |
Inc / Corner |
| 1 |
57880 |
Tarmo Leola |
0.008 |
| 2 |
107777 |
Ryan Kuhn |
0.011 |
| 3 |
98759 |
Dustin Herröder |
0.012 |
| 4 |
83744 |
Sean Albright |
0.013 |
| 5 |
200160 |
Seth Rawls |
0.013 |