Advanced Legends Cup
2017 Season 2
- 3,702 unique drivers averaging 6.06 starts each.
- 113 drivers raced in 8 or more weeks.
- 2,200 official races with an average SOF of 1,588.
- 712,491 laps were completed with 54,712 incidents.
Week 1
[Legacy] Charlotte Motor Speedway - 2008
Legends Oval
- Total official races: 166
- Total drivers: 2,852
- Unique drivers: 1,050
- Highest SoF: 3,530
- Average SoF: 1,755
| # |
groupid |
Driver |
Points |
| 1 |
173787 |
Riley Stenjem |
177 |
| 2 |
58500 |
Jacob Harberts |
167 |
| 3 |
251202 |
Alex McCollum3 |
163 |
Week 2
Oxford Plains Speedway
- Total official races: 168
- Total drivers: 1,713
- Unique drivers: 673
- Highest SoF: 3,207
- Average SoF: 1,626
| # |
groupid |
Driver |
Points |
| 1 |
173787 |
Riley Stenjem |
153 |
| 2 |
121001 |
Alex Crapser |
153 |
| 3 |
77834 |
Jim George |
150 |
Week 3
USA International Speedway
Asphalt
- Total official races: 212
- Total drivers: 4,558
- Unique drivers: 1,460
- Highest SoF: 3,567
- Average SoF: 1,480
| # |
groupid |
Driver |
Points |
| 1 |
143103 |
Ryan Doucette |
170 |
| 2 |
58500 |
Jacob Harberts |
158 |
| 3 |
77834 |
Jim George |
156 |
Week 4
South Boston Speedway
- Total official races: 135
- Total drivers: 3,727
- Unique drivers: 1,154
- Highest SoF: 4,553
- Average SoF: 1,756
| # |
groupid |
Driver |
Points |
| 1 |
143103 |
Ryan Doucette |
209 |
| 2 |
251202 |
Alex McCollum3 |
190 |
| 3 |
246788 |
Tyler Severa |
152 |
Week 5
Thompson Speedway Motorsports Park
Oval
- Total official races: 189
- Total drivers: 3,952
- Unique drivers: 1,213
- Highest SoF: 3,242
- Average SoF: 1,571
| # |
groupid |
Driver |
Points |
| 1 |
77834 |
Jim George |
138 |
| 2 |
108148 |
Ryan Matthews |
133 |
| 3 |
69580 |
Parker J. Steele |
133 |
Week 6
Lanier National Speedway
Asphalt
- Total official races: 200
- Total drivers: 4,059
- Unique drivers: 1,161
- Highest SoF: 3,274
- Average SoF: 1,596
| # |
groupid |
Driver |
Points |
| 1 |
143103 |
Ryan Doucette |
149 |
| 2 |
251202 |
Alex McCollum3 |
140 |
| 3 |
108148 |
Ryan Matthews |
137 |
Week 7
[Legacy] Charlotte Motor Speedway - 2008
Legends Oval
- Total official races: 136
- Total drivers: 2,852
- Unique drivers: 1,050
- Highest SoF: 3,228
- Average SoF: 1,612
| # |
groupid |
Driver |
Points |
| 1 |
143103 |
Ryan Doucette |
155 |
| 2 |
119681 |
Logan Clampitt |
143 |
| 3 |
251202 |
Alex McCollum3 |
142 |
- Total official races: 151
- Total drivers: 1,565
- Unique drivers: 577
- Highest SoF: 2,882
- Average SoF: 1,598
| # |
groupid |
Driver |
Points |
| 1 |
251202 |
Alex McCollum3 |
129 |
| 2 |
198464 |
Andre Fiorini |
128 |
| 3 |
256938 |
Zach Miller |
127 |
Week 9
USA International Speedway
Asphalt
- Total official races: 227
- Total drivers: 4,558
- Unique drivers: 1,460
- Highest SoF: 3,185
- Average SoF: 1,532
| # |
groupid |
Driver |
Points |
| 1 |
251202 |
Alex McCollum3 |
153 |
| 2 |
113861 |
Alex Bergeron |
145 |
| 3 |
52087 |
Alton Parsons2 |
138 |
Week 10
South Boston Speedway
- Total official races: 224
- Total drivers: 3,727
- Unique drivers: 1,154
- Highest SoF: 3,285
- Average SoF: 1,572
| # |
groupid |
Driver |
Points |
| 1 |
77834 |
Jim George |
165 |
| 2 |
143103 |
Ryan Doucette |
159 |
| 3 |
149073 |
Justin Lisonbee |
148 |
Week 11
Thompson Speedway Motorsports Park
Oval
- Total official races: 195
- Total drivers: 3,952
- Unique drivers: 1,213
- Highest SoF: 3,112
- Average SoF: 1,550
| # |
groupid |
Driver |
Points |
| 1 |
134816 |
Bobby Maiden III |
136 |
| 2 |
143103 |
Ryan Doucette |
136 |
| 3 |
58500 |
Jacob Harberts |
130 |
Week 12
Lanier National Speedway
Asphalt
- Total official races: 197
- Total drivers: 4,059
- Unique drivers: 1,161
- Highest SoF: 2,992
- Average SoF: 1,526
| # |
groupid |
Driver |
Points |
| 1 |
143103 |
Ryan Doucette |
152 |
| 2 |
173787 |
Riley Stenjem |
149 |
| 3 |
251202 |
Alex McCollum3 |
143 |
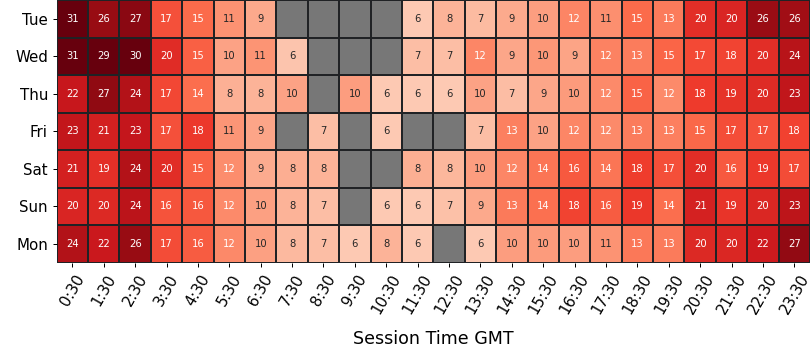
Participation
average number of drivers in each time slot
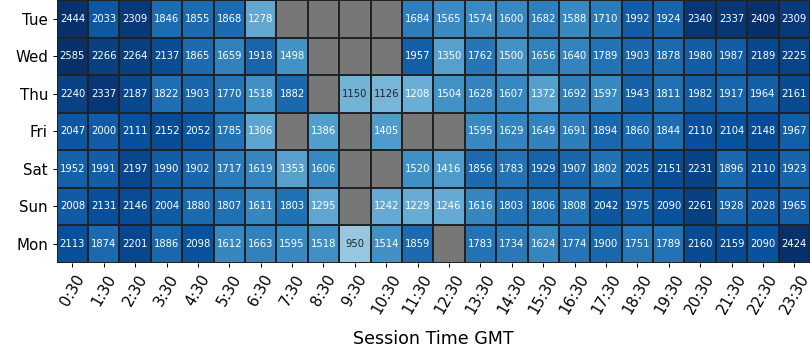
Strength of Field
average SoF of the top split for each time slot
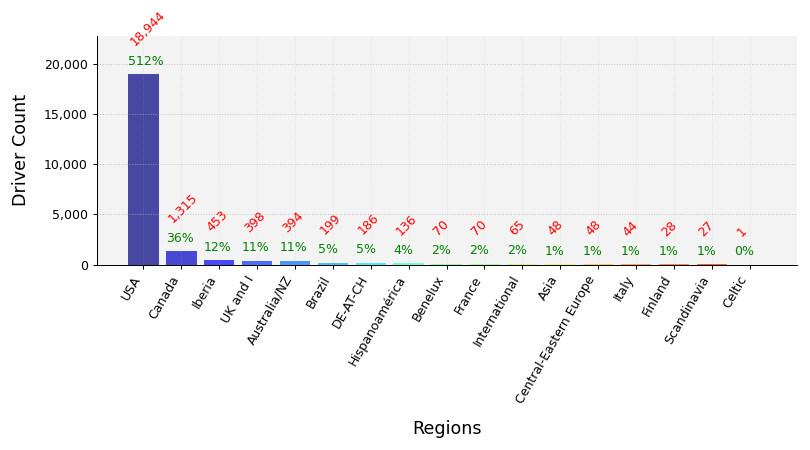
Clubs Distribution
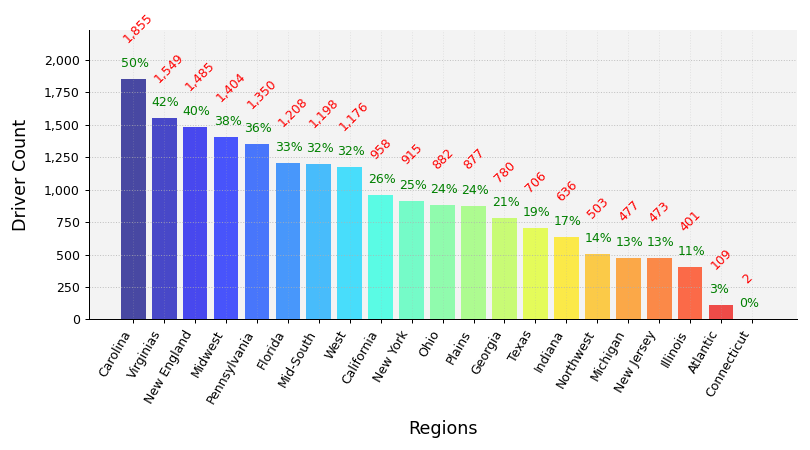
USA Clubs Distribution
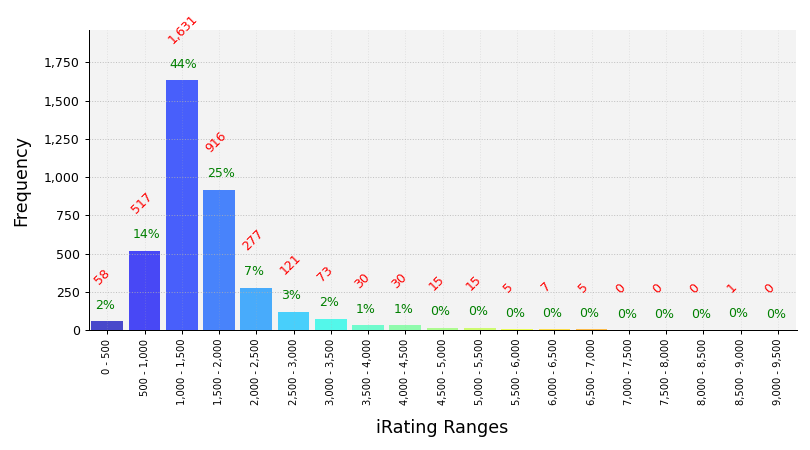
iRating Distribution
Championship Points
| # |
groupid |
Driver |
Points |
| 1 |
143103 |
Ryan Doucette |
1,283 |
| 2 |
251202 |
Alex McCollum3 |
1,206 |
| 3 |
263941 |
Aaron Mulrooney Jr |
1,086 |
| 4 |
108148 |
Ryan Matthews |
1,068 |
| 5 |
155936 |
Chris Silvestri |
1,012 |
Most Race Starts
| # |
groupid |
Driver |
Starts |
| 1 |
264632 |
Darold Mathews |
242 |
| 2 |
268237 |
William White4 |
194 |
| 3 |
231066 |
Braden Graham |
192 |
| 4 |
228088 |
Blaze Crawford |
167 |
| 5 |
52488 |
James A. Larner |
159 |
Grand Chelems
pole position, won race, fastest lap, led every lap (perfect if 0 inc)
| # |
groupid |
Driver |
Grand Chelems |
Chelem % |
Perfects |
| 1 |
263941 |
Aaron Mulrooney Jr |
89 |
55% |
86 |
| 2 |
231066 |
Braden Graham |
73 |
30% |
57 |
| 3 |
108148 |
Ryan Matthews |
49 |
40% |
36 |
| 4 |
149073 |
Justin Lisonbee |
41 |
30% |
35 |
| 5 |
77834 |
Jim George |
31 |
39% |
27 |
Average Finish Position
drivers must have raced 8 or more weeks to feature in this table
| # |
groupid |
Driver |
Avg Finish Pos |
Races |
| 1 |
143103 |
Ryan Doucette |
1.5 |
29 |
| 2 |
263941 |
Aaron Mulrooney Jr |
1.8 |
157 |
| 3 |
108148 |
Ryan Matthews |
1.9 |
89 |
| 4 |
251202 |
Alex McCollum3 |
2.1 |
35 |
| 5 |
231066 |
Braden Graham |
2.1 |
192 |
Most Wins
| # |
groupid |
Driver |
Wins |
| 1 |
231066 |
Braden Graham |
107 |
| 2 |
263941 |
Aaron Mulrooney Jr |
102 |
| 3 |
108148 |
Ryan Matthews |
66 |
| 4 |
149073 |
Justin Lisonbee |
64 |
| 5 |
228088 |
Blaze Crawford |
60 |
Most Podiums
| # |
groupid |
Driver |
Podiums |
| 1 |
231066 |
Braden Graham |
165 |
| 2 |
228088 |
Blaze Crawford |
145 |
| 3 |
263941 |
Aaron Mulrooney Jr |
145 |
| 4 |
149073 |
Justin Lisonbee |
104 |
| 5 |
264632 |
Darold Mathews |
81 |
Most Poles
| # |
groupid |
Driver |
Poles |
| 1 |
263941 |
Aaron Mulrooney Jr |
111 |
| 2 |
231066 |
Braden Graham |
95 |
| 3 |
149073 |
Justin Lisonbee |
69 |
| 4 |
108148 |
Ryan Matthews |
68 |
| 5 |
228088 |
Blaze Crawford |
62 |
Best Win Percentage
drivers must have raced 8 or more weeks to feature in this table
| # |
groupid |
Driver |
Win % |
Races |
| 1 |
108148 |
Ryan Matthews |
74% |
89 |
| 2 |
143103 |
Ryan Doucette |
66% |
29 |
| 3 |
263941 |
Aaron Mulrooney Jr |
65% |
157 |
| 4 |
77834 |
Jim George |
60% |
70 |
| 5 |
251202 |
Alex McCollum3 |
57% |
35 |
Best Podium Percentage
drivers must have raced 8 or more weeks to feature in this table
| # |
groupid |
Driver |
Podium % |
Races |
| 1 |
143103 |
Ryan Doucette |
97% |
29 |
| 2 |
263941 |
Aaron Mulrooney Jr |
92% |
157 |
| 3 |
108148 |
Ryan Matthews |
91% |
89 |
| 4 |
251202 |
Alex McCollum3 |
89% |
35 |
| 5 |
149073 |
Justin Lisonbee |
88% |
118 |
Best Pole Percentage
drivers must have raced 8 or more weeks to feature in this table
| # |
groupid |
Driver |
Pole % |
Races |
| 1 |
108148 |
Ryan Matthews |
76% |
89 |
| 2 |
263941 |
Aaron Mulrooney Jr |
71% |
157 |
| 3 |
149073 |
Justin Lisonbee |
58% |
118 |
| 4 |
77834 |
Jim George |
56% |
70 |
| 5 |
231066 |
Braden Graham |
49% |
192 |
Best Average iRating Gains
drivers must have raced 8 or more weeks to feature in this table
| # |
groupid |
Team |
Avg iRating +/- |
Races |
| 1 |
145809 |
Randy Capps |
40 |
13 |
| 2 |
255044 |
Brandon Scercy |
34 |
26 |
| 3 |
247919 |
Alffy Charron Jr |
32 |
30 |
| 4 |
243554 |
Garland Bennett |
29 |
17 |
| 5 |
272660 |
Trevor Hoek |
29 |
66 |
Highest Total iRating Gains
| # |
groupid |
Team |
iRating +/- |
Races |
| 1 |
231066 |
Braden Graham |
2,608 |
192 |
| 2 |
264632 |
Darold Mathews |
2,515 |
242 |
| 3 |
228088 |
Blaze Crawford |
2,482 |
167 |
| 4 |
112375 |
Jay Hollingsworth |
2,284 |
94 |
| 5 |
55034 |
Michael Meek |
2,125 |
101 |
Cleanest Drivers
drivers must have raced 8 or more weeks to feature in this table
| # |
groupid |
Driver |
Inc / Corner |
| 1 |
183484 |
Matt Pollard2 |
0.006 |
| 2 |
145809 |
Randy Capps |
0.008 |
| 3 |
263941 |
Aaron Mulrooney Jr |
0.008 |
| 4 |
119377 |
David Powers |
0.009 |
| 5 |
142920 |
Lawrence Pollock |
0.012 |