DIRTcar 360 Sprint Car Series
2017 Season 2
- 4,275 unique drivers averaging 8.39 starts each.
- 424 drivers raced in 7 or more weeks.
- 2,756 official races with an average SOF of 1,902.
- 810,754 laps were completed with 107,603 incidents.
Week 1
Williams Grove Speedway
- Total official races: 363
- Total drivers: 10,414
- Unique drivers: 2,624
- Highest SoF: 5,875
- Average SoF: 2,090
| # |
groupid |
Driver |
Points |
| 1 |
46789 |
Dylan Sharman |
284 |
| 2 |
87145 |
Logan Seavey |
282 |
| 3 |
115041 |
Nathan Wise |
275 |
- Total official races: 409
- Total drivers: 12,177
- Unique drivers: 2,843
- Highest SoF: 6,079
- Average SoF: 1,911
| # |
groupid |
Driver |
Points |
| 1 |
64259 |
Christopher Bell |
286 |
| 2 |
87145 |
Logan Seavey |
279 |
| 3 |
115041 |
Nathan Wise |
262 |
Week 3
USA International Speedway
Dirt
- Total official races: 307
- Total drivers: 6,745
- Unique drivers: 1,794
- Highest SoF: 4,578
- Average SoF: 1,805
| # |
groupid |
Driver |
Points |
| 1 |
17651 |
Kevin Swindell |
226 |
| 2 |
87145 |
Logan Seavey |
215 |
| 3 |
73546 |
Dillon Raffurty |
215 |
Week 4
Volusia Speedway Park
- Total official races: 288
- Total drivers: 6,515
- Unique drivers: 1,626
- Highest SoF: 4,445
- Average SoF: 1,860
| # |
groupid |
Driver |
Points |
| 1 |
25075 |
Tyler Laughlin |
220 |
| 2 |
73546 |
Dillon Raffurty |
208 |
| 3 |
18340 |
Justin Fuller |
207 |
Week 5
Williams Grove Speedway
- Total official races: 230
- Total drivers: 10,414
- Unique drivers: 2,624
- Highest SoF: 4,410
- Average SoF: 1,893
| # |
groupid |
Driver |
Points |
| 1 |
87145 |
Logan Seavey |
227 |
| 2 |
25075 |
Tyler Laughlin |
209 |
| 3 |
64259 |
Christopher Bell |
208 |
- Total official races: 279
- Total drivers: 12,177
- Unique drivers: 2,843
- Highest SoF: 4,267
- Average SoF: 1,876
| # |
groupid |
Driver |
Points |
| 1 |
25075 |
Tyler Laughlin |
220 |
| 2 |
18045 |
Justin Thomas |
219 |
| 3 |
92134 |
Christopher Kurdziel |
211 |
Week 7
USA International Speedway
Dirt
- Total official races: 218
- Total drivers: 6,745
- Unique drivers: 1,794
- Highest SoF: 4,327
- Average SoF: 1,822
| # |
groupid |
Driver |
Points |
| 1 |
87145 |
Logan Seavey |
219 |
| 2 |
56503 |
Kevin J Holley |
203 |
| 3 |
58176 |
Chase Briscoe |
202 |
Week 8
Volusia Speedway Park
- Total official races: 220
- Total drivers: 6,515
- Unique drivers: 1,626
- Highest SoF: 4,538
- Average SoF: 1,914
| # |
groupid |
Driver |
Points |
| 1 |
87145 |
Logan Seavey |
226 |
| 2 |
29915 |
Mike McKinney |
207 |
| 3 |
77711 |
James Edens |
196 |
Week 9
Williams Grove Speedway
- Total official races: 200
- Total drivers: 10,414
- Unique drivers: 2,624
- Highest SoF: 4,030
- Average SoF: 1,909
| # |
groupid |
Driver |
Points |
| 1 |
17651 |
Kevin Swindell |
189 |
| 2 |
29915 |
Mike McKinney |
189 |
| 3 |
97392 |
Matthew McKinney |
184 |
- Total official races: 242
- Total drivers: 12,177
- Unique drivers: 2,843
- Highest SoF: 4,732
- Average SoF: 1,874
| # |
groupid |
Driver |
Points |
| 1 |
77711 |
James Edens |
223 |
| 2 |
56503 |
Kevin J Holley |
212 |
| 3 |
116335 |
Tim Ryan |
206 |
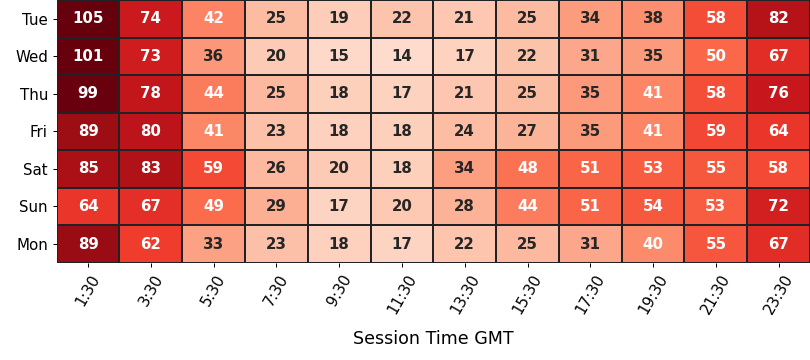
Participation
average number of drivers in each time slot
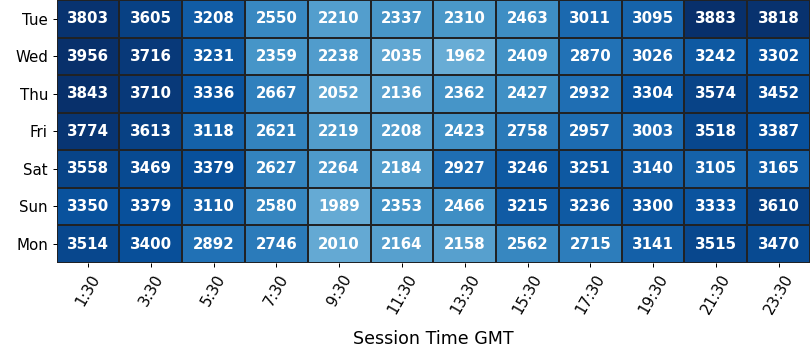
Strength of Field
average SoF of the top split for each time slot
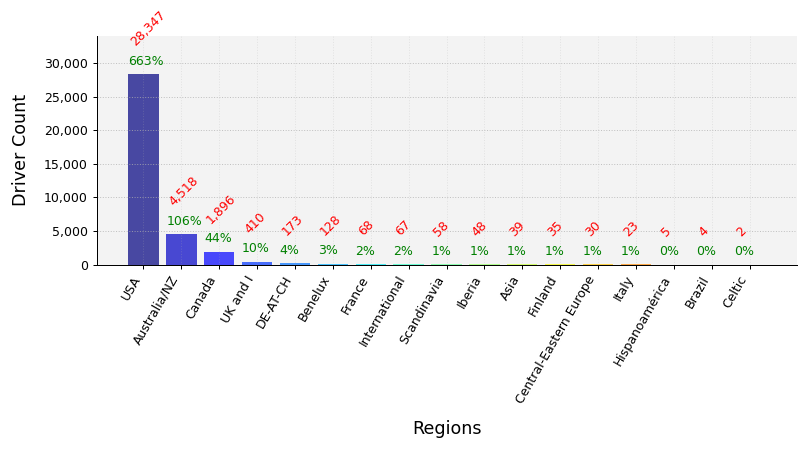
Clubs Distribution
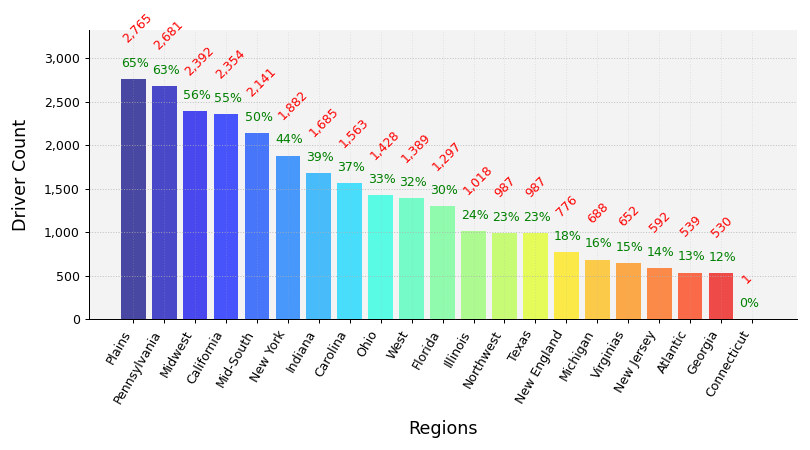
USA Clubs Distribution
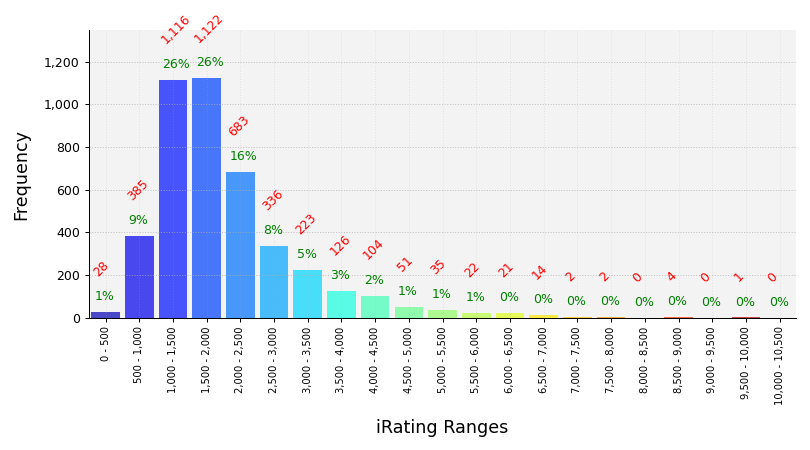
iRating Distribution
Championship Points
| # |
groupid |
Driver |
Points |
| 1 |
87145 |
Logan Seavey |
1,645 |
| 2 |
25075 |
Tyler Laughlin |
1,405 |
| 3 |
56503 |
Kevin J Holley |
1,377 |
| 4 |
58176 |
Chase Briscoe |
1,355 |
| 5 |
162481 |
Colton W Hardy |
1,349 |
Most Race Starts
| # |
groupid |
Driver |
Starts |
| 1 |
76649 |
Craig LeVan |
230 |
| 2 |
18805 |
Anthony Long |
167 |
| 3 |
270309 |
Kyle Trevathan |
162 |
| 4 |
269458 |
Anthony J Corini |
155 |
| 5 |
251721 |
Robert Kerstetter2 |
151 |
Grand Chelems
pole position, won race, fastest lap, led every lap (perfect if 0 inc)
| # |
groupid |
Driver |
Grand Chelems |
Chelem % |
Perfects |
| 1 |
25075 |
Tyler Laughlin |
24 |
33% |
21 |
| 2 |
18340 |
Justin Fuller |
18 |
16% |
16 |
| 3 |
255299 |
Brad Nichols |
17 |
19% |
14 |
| 4 |
87145 |
Logan Seavey |
16 |
38% |
15 |
| 5 |
116335 |
Tim Ryan |
15 |
27% |
9 |
Average Finish Position
drivers must have raced 7 or more weeks to feature in this table
| # |
groupid |
Driver |
Avg Finish Pos |
Races |
| 1 |
87145 |
Logan Seavey |
1.8 |
40 |
| 2 |
25075 |
Tyler Laughlin |
2.2 |
63 |
| 3 |
50483 |
Davey Scovel |
2.7 |
37 |
| 4 |
56503 |
Kevin J Holley |
2.9 |
53 |
| 5 |
256268 |
Dustin Dougan |
3.0 |
25 |
Most Wins
| # |
groupid |
Driver |
Wins |
| 1 |
25075 |
Tyler Laughlin |
44 |
| 2 |
18340 |
Justin Fuller |
39 |
| 3 |
251721 |
Robert Kerstetter2 |
31 |
| 4 |
87145 |
Logan Seavey |
29 |
| 5 |
76649 |
Craig LeVan |
27 |
Most Podiums
| # |
groupid |
Driver |
Podiums |
| 1 |
76649 |
Craig LeVan |
93 |
| 2 |
18340 |
Justin Fuller |
69 |
| 3 |
251721 |
Robert Kerstetter2 |
65 |
| 4 |
272849 |
Lewis Hewett |
58 |
| 5 |
25075 |
Tyler Laughlin |
54 |
Most Poles
| # |
groupid |
Driver |
Poles |
| 1 |
76649 |
Craig LeVan |
42 |
| 2 |
255299 |
Brad Nichols |
33 |
| 3 |
25075 |
Tyler Laughlin |
33 |
| 4 |
272849 |
Lewis Hewett |
31 |
| 5 |
18340 |
Justin Fuller |
29 |
Best Win Percentage
drivers must have raced 7 or more weeks to feature in this table
| # |
groupid |
Driver |
Win % |
Races |
| 1 |
87145 |
Logan Seavey |
72% |
40 |
| 2 |
25075 |
Tyler Laughlin |
70% |
63 |
| 3 |
26235 |
Giovanni Mungin |
64% |
14 |
| 4 |
50483 |
Davey Scovel |
59% |
37 |
| 5 |
256268 |
Dustin Dougan |
52% |
25 |
Best Podium Percentage
drivers must have raced 7 or more weeks to feature in this table
| # |
groupid |
Driver |
Podium % |
Races |
| 1 |
87145 |
Logan Seavey |
90% |
40 |
| 2 |
25075 |
Tyler Laughlin |
86% |
63 |
| 3 |
50483 |
Davey Scovel |
81% |
37 |
| 4 |
154818 |
Nicholas J Ciambrone |
77% |
13 |
| 5 |
124353 |
Nick Cooper |
76% |
21 |
Best Pole Percentage
drivers must have raced 7 or more weeks to feature in this table
| # |
groupid |
Driver |
Pole % |
Races |
| 1 |
26235 |
Giovanni Mungin |
71% |
14 |
| 2 |
50483 |
Davey Scovel |
62% |
37 |
| 3 |
87145 |
Logan Seavey |
60% |
40 |
| 4 |
24886 |
Robert Bieber |
60% |
15 |
| 5 |
25075 |
Tyler Laughlin |
52% |
63 |
Best Average iRating Gains
drivers must have raced 7 or more weeks to feature in this table
| # |
groupid |
Team |
Avg iRating +/- |
Races |
| 1 |
154818 |
Nicholas J Ciambrone |
65 |
13 |
| 2 |
256268 |
Dustin Dougan |
57 |
25 |
| 3 |
193642 |
Chase D Johnson |
54 |
21 |
| 4 |
171627 |
Kevin Mostert |
50 |
10 |
| 5 |
18045 |
Justin Thomas |
43 |
40 |
Highest Total iRating Gains
| # |
groupid |
Team |
iRating +/- |
Races |
| 1 |
76649 |
Craig LeVan |
3,713 |
230 |
| 2 |
251721 |
Robert Kerstetter2 |
3,229 |
151 |
| 3 |
29361 |
Eric Caron |
2,288 |
71 |
| 4 |
215701 |
Ryan Robinson2 |
2,269 |
41 |
| 5 |
41103 |
Trevir Camp |
2,214 |
74 |
Cleanest Drivers
drivers must have raced 7 or more weeks to feature in this table
| # |
groupid |
Driver |
Inc / Corner |
| 1 |
20107 |
Matt Berndt |
0.003 |
| 2 |
166189 |
Matthew Trotman |
0.007 |
| 3 |
256268 |
Dustin Dougan |
0.008 |
| 4 |
117884 |
Laura Gerhardt |
0.009 |
| 5 |
50483 |
Davey Scovel |
0.010 |