ARCA Menards Series
2017 Season 3
- 6,074 unique drivers averaging 6.26 starts each.
- 251 drivers raced in 8 or more weeks.
- 2,007 official races with an average SOF of 1,652.
- 1,219,306 laps were completed with 164,024 incidents.
Week 1
Daytona International Speedway
Oval
- Total official races: 328
- Total drivers: 6,878
- Unique drivers: 2,122
- Highest SoF: 3,907
- Average SoF: 1,571
| # |
groupid |
Driver |
Points |
| 1 |
97243 |
Logan Kress |
220 |
| 2 |
18340 |
Justin Fuller |
212 |
| 3 |
171300 |
Mathew Thunhorst |
202 |
Week 2
New Smyrna Speedway
- Total official races: 104
- Total drivers: 1,703
- Unique drivers: 770
- Highest SoF: 3,487
- Average SoF: 1,645
| # |
groupid |
Driver |
Points |
| 1 |
236677 |
Cornelius Scott |
181 |
| 2 |
191153 |
Ryan Wilson6 |
165 |
| 3 |
249305 |
Brandon Hanks |
150 |
Week 3
Iowa Speedway
Oval
- Total official races: 170
- Total drivers: 3,234
- Unique drivers: 1,216
- Highest SoF: 3,533
- Average SoF: 1,727
| # |
groupid |
Driver |
Points |
| 1 |
121248 |
Brandon Pipgrass |
192 |
| 2 |
164714 |
Isaac Gann |
190 |
| 3 |
160763 |
Eric J. Smith |
184 |
Week 4
Myrtle Beach Speedway
- Total official races: 95
- Total drivers: 1,502
- Unique drivers: 583
- Highest SoF: 2,951
- Average SoF: 1,570
| # |
groupid |
Driver |
Points |
| 1 |
172758 |
Jacob Nottestad |
163 |
| 2 |
140820 |
Derek Kraus |
147 |
| 3 |
189631 |
John Ludke |
142 |
- Total official races: 79
- Total drivers: 1,313
- Unique drivers: 553
- Highest SoF: 3,001
- Average SoF: 1,770
| # |
groupid |
Driver |
Points |
| 1 |
139875 |
Austin M Jones |
156 |
| 2 |
70865 |
Hunter Combs |
146 |
| 3 |
170738 |
Arthur Rymer |
143 |
Week 6
Bristol Motor Speedway
Dual Pit Roads
- Total official races: 169
- Total drivers: 3,128
- Unique drivers: 1,314
- Highest SoF: 3,445
- Average SoF: 1,674
| # |
groupid |
Driver |
Points |
| 1 |
167354 |
Liam Brotherton |
180 |
| 2 |
260356 |
Steven Wilson3 |
177 |
| 3 |
87660 |
Ethan Lane |
174 |
Week 7
Irwindale Speedway
Outer
- Total official races: 92
- Total drivers: 1,562
- Unique drivers: 713
- Highest SoF: 3,099
- Average SoF: 1,681
| # |
groupid |
Driver |
Points |
| 1 |
134640 |
James Linkiewicz |
159 |
| 2 |
173787 |
Riley Stenjem |
149 |
| 3 |
49942 |
Brenden Baker |
149 |
Week 8
South Boston Speedway
- Total official races: 181
- Total drivers: 3,376
- Unique drivers: 1,483
- Highest SoF: 3,583
- Average SoF: 1,684
| # |
groupid |
Driver |
Points |
| 1 |
34809 |
Michael Guest |
192 |
| 2 |
46206 |
Matthew Wright2 |
183 |
| 3 |
33240 |
Josh Weinrich |
179 |
Week 9
Thompson Speedway Motorsports Park
Oval
- Total official races: 133
- Total drivers: 2,399
- Unique drivers: 1,194
- Highest SoF: 2,976
- Average SoF: 1,641
| # |
groupid |
Driver |
Points |
| 1 |
31625 |
Alfred Terra |
173 |
| 2 |
143103 |
Ryan Doucette |
171 |
| 3 |
82790 |
Mason A. Diaz |
162 |
Week 10
New Hampshire Motor Speedway
Oval
- Total official races: 136
- Total drivers: 2,331
- Unique drivers: 1,035
- Highest SoF: 3,697
- Average SoF: 1,816
| # |
groupid |
Driver |
Points |
| 1 |
280366 |
Scott Price |
200 |
| 2 |
49858 |
Alex Bisson |
190 |
| 3 |
173787 |
Riley Stenjem |
180 |
Week 11
Dover International Speedway
- Total official races: 182
- Total drivers: 3,456
- Unique drivers: 1,305
- Highest SoF: 4,519
- Average SoF: 1,789
| # |
groupid |
Driver |
Points |
| 1 |
15780 |
Brian Schoenburg |
244 |
| 2 |
17027 |
Harrison Widelitz |
230 |
| 3 |
52025 |
Justin Bolton |
220 |
Week 12
[Legacy] Charlotte Motor Speedway - 2008
Oval
- Total official races: 338
- Total drivers: 7,150
- Unique drivers: 2,450
- Highest SoF: 3,365
- Average SoF: 1,521
| # |
groupid |
Driver |
Points |
| 1 |
107777 |
Ryan Kuhn |
194 |
| 2 |
143103 |
Ryan Doucette |
191 |
| 3 |
232850 |
Ryan Farmer2 |
183 |
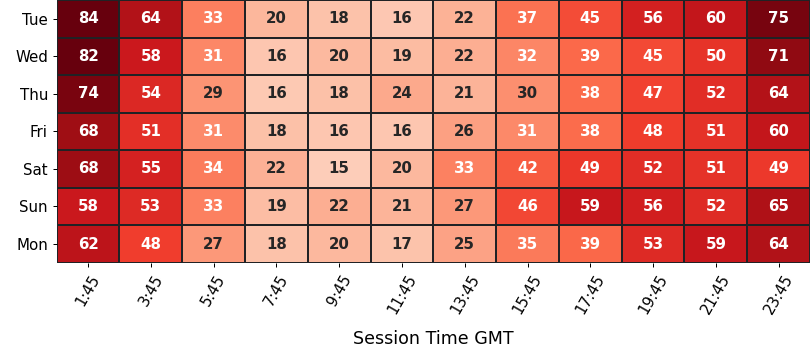
Participation
average number of drivers in each time slot
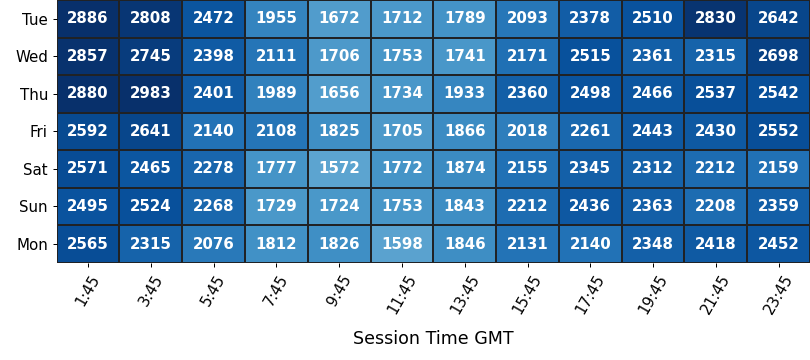
Strength of Field
average SoF of the top split for each time slot
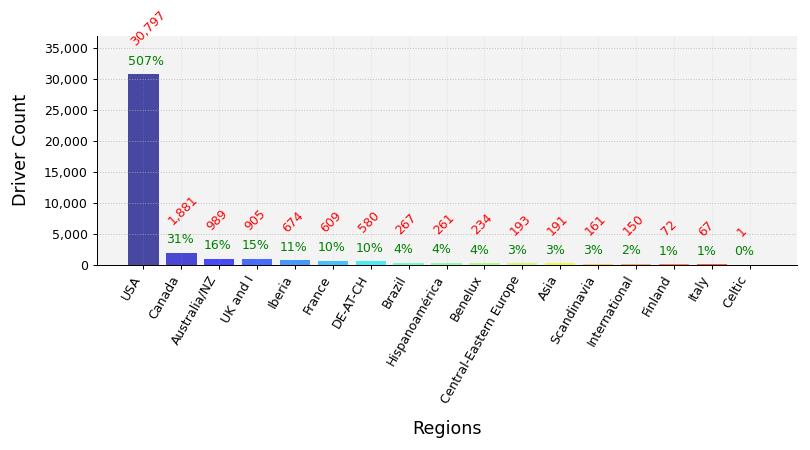
Clubs Distribution
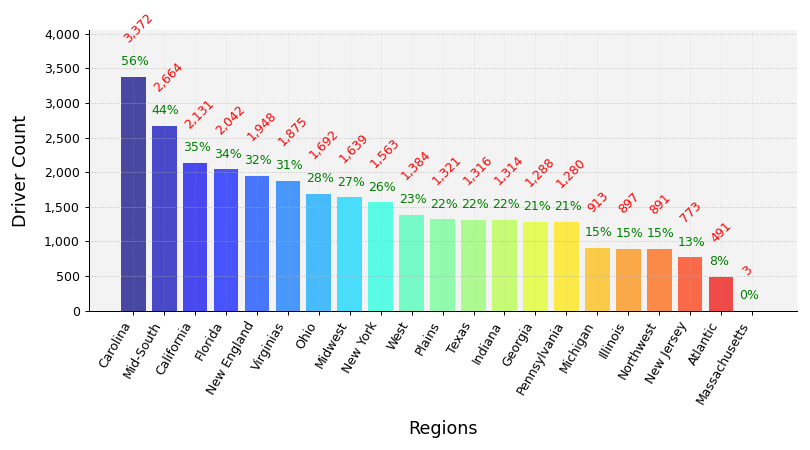
USA Clubs Distribution
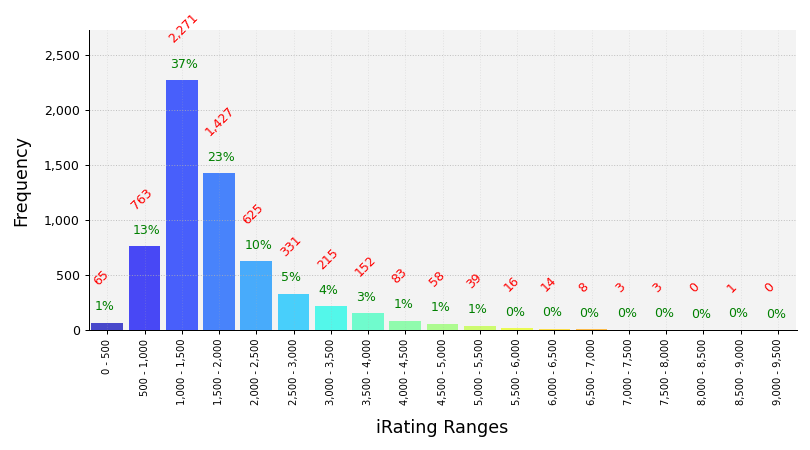
iRating Distribution
Championship Points
| # |
groupid |
Driver |
Points |
| 1 |
34809 |
Michael Guest |
1,331 |
| 2 |
189631 |
John Ludke |
1,314 |
| 3 |
173787 |
Riley Stenjem |
1,180 |
| 4 |
143103 |
Ryan Doucette |
1,175 |
| 5 |
107777 |
Ryan Kuhn |
1,175 |
Most Race Starts
| # |
groupid |
Driver |
Starts |
| 1 |
213534 |
Joseph Lepore |
177 |
| 2 |
143154 |
Leighton B Sibille |
108 |
| 3 |
142920 |
Lawrence Pollock |
96 |
| 4 |
279139 |
Mike King5 |
84 |
| 5 |
180791 |
Richard Springer |
81 |
Grand Chelems
pole position, won race, fastest lap, led every lap (perfect if 0 inc)
| # |
groupid |
Driver |
Grand Chelems |
Chelem % |
Perfects |
| 1 |
143154 |
Leighton B Sibille |
19 |
17% |
18 |
| 2 |
34809 |
Michael Guest |
18 |
25% |
18 |
| 3 |
43417 |
Nathan Lyon |
14 |
61% |
14 |
| 4 |
155936 |
Chris Silvestri |
12 |
14% |
10 |
| 5 |
260356 |
Steven Wilson3 |
11 |
19% |
7 |
Average Finish Position
drivers must have raced 8 or more weeks to feature in this table
| # |
groupid |
Driver |
Avg Finish Pos |
Races |
| 1 |
34809 |
Michael Guest |
3.0 |
73 |
| 2 |
186445 |
Jason M Hughes |
3.1 |
8 |
| 3 |
218538 |
Andy Trupiano |
3.2 |
27 |
| 4 |
194770 |
Garrett Manes |
3.5 |
34 |
| 5 |
173787 |
Riley Stenjem |
3.8 |
21 |
Most Wins
| # |
groupid |
Driver |
Wins |
| 1 |
34809 |
Michael Guest |
44 |
| 2 |
143154 |
Leighton B Sibille |
38 |
| 3 |
155936 |
Chris Silvestri |
20 |
| 4 |
189631 |
John Ludke |
17 |
| 5 |
31096 |
Jeremy B Davis |
17 |
Most Podiums
| # |
groupid |
Driver |
Podiums |
| 1 |
143154 |
Leighton B Sibille |
74 |
| 2 |
34809 |
Michael Guest |
59 |
| 3 |
155936 |
Chris Silvestri |
42 |
| 4 |
213534 |
Joseph Lepore |
35 |
| 5 |
31096 |
Jeremy B Davis |
34 |
Most Poles
| # |
groupid |
Driver |
Poles |
| 1 |
34809 |
Michael Guest |
39 |
| 2 |
143154 |
Leighton B Sibille |
25 |
| 3 |
155936 |
Chris Silvestri |
24 |
| 4 |
189631 |
John Ludke |
23 |
| 5 |
260356 |
Steven Wilson3 |
18 |
Best Win Percentage
drivers must have raced 8 or more weeks to feature in this table
| # |
groupid |
Driver |
Win % |
Races |
| 1 |
34809 |
Michael Guest |
60% |
73 |
| 2 |
46206 |
Matthew Wright2 |
52% |
27 |
| 3 |
194770 |
Garrett Manes |
47% |
34 |
| 4 |
254004 |
John Smith14 |
42% |
31 |
| 5 |
266625 |
Trevor Graffam |
38% |
29 |
Best Podium Percentage
drivers must have raced 8 or more weeks to feature in this table
| # |
groupid |
Driver |
Podium % |
Races |
| 1 |
34809 |
Michael Guest |
81% |
73 |
| 2 |
218538 |
Andy Trupiano |
81% |
27 |
| 3 |
194770 |
Garrett Manes |
71% |
34 |
| 4 |
173787 |
Riley Stenjem |
71% |
21 |
| 5 |
143154 |
Leighton B Sibille |
69% |
108 |
Best Pole Percentage
drivers must have raced 8 or more weeks to feature in this table
| # |
groupid |
Driver |
Pole % |
Races |
| 1 |
34809 |
Michael Guest |
53% |
73 |
| 2 |
194770 |
Garrett Manes |
47% |
34 |
| 3 |
173787 |
Riley Stenjem |
43% |
21 |
| 4 |
218538 |
Andy Trupiano |
41% |
27 |
| 5 |
254004 |
John Smith14 |
39% |
31 |
Best Average iRating Gains
drivers must have raced 8 or more weeks to feature in this table
| # |
groupid |
Team |
Avg iRating +/- |
Races |
| 1 |
28148 |
Adam Heili |
52 |
8 |
| 2 |
254004 |
John Smith14 |
38 |
31 |
| 3 |
266625 |
Trevor Graffam |
35 |
29 |
| 4 |
42468 |
Devin Chapman |
33 |
12 |
| 5 |
89808 |
Dewey Hall |
30 |
11 |
Highest Total iRating Gains
| # |
groupid |
Team |
iRating +/- |
Races |
| 1 |
213534 |
Joseph Lepore |
2,037 |
177 |
| 2 |
62022 |
Don Bryan |
1,615 |
64 |
| 3 |
143154 |
Leighton B Sibille |
1,463 |
108 |
| 4 |
279766 |
Christopher Johnson9 |
1,224 |
47 |
| 5 |
254004 |
John Smith14 |
1,166 |
31 |
Cleanest Drivers
drivers must have raced 8 or more weeks to feature in this table
| # |
groupid |
Driver |
Inc / Corner |
| 1 |
272898 |
Jared Wishon |
0.006 |
| 2 |
218538 |
Andy Trupiano |
0.007 |
| 3 |
266555 |
Ralph Simpson |
0.007 |
| 4 |
186445 |
Jason M Hughes |
0.008 |
| 5 |
34809 |
Michael Guest |
0.009 |