AMSOIL USAC Sprint Car
2017 Season 4
- 276 unique drivers averaging 3.14 starts each.
- 9 drivers raced in 8 or more weeks.
- 99 official races with an average SOF of 2,944.
- 17,089 laps were completed with 1,916 incidents.
- Total official races: 12
- Total drivers: 303
- Unique drivers: 148
- Highest SoF: 3,934
- Average SoF: 2,824
| # |
groupid |
Driver |
Points |
| 1 |
56503 |
Kevin J Holley |
180 |
| 2 |
147945 |
John M LoPresto |
144 |
| 3 |
15583 |
Thomas Lewandowski |
141 |
Week 2
Volusia Speedway Park
- Total official races: 6
- Total drivers: 167
- Unique drivers: 94
- Highest SoF: 3,125
- Average SoF: 2,747
| # |
groupid |
Driver |
Points |
| 1 |
56503 |
Kevin J Holley |
152 |
| 2 |
48469 |
Nick Nickerson |
137 |
| 3 |
58176 |
Chase Briscoe |
136 |
Week 3
USA International Speedway
Dirt
- Total official races: 5
- Total drivers: 44
- Unique drivers: 28
- Highest SoF: 3,809
- Average SoF: 3,391
| # |
groupid |
Driver |
Points |
| 1 |
147945 |
John M LoPresto |
188 |
| 2 |
56503 |
Kevin J Holley |
168 |
| 3 |
159663 |
Ross Wece |
158 |
Week 4
Williams Grove Speedway
- Total official races: 2
- Total drivers: 40
- Unique drivers: 25
- Highest SoF: 3,456
- Average SoF: 3,249
| # |
groupid |
Driver |
Points |
| 1 |
58176 |
Chase Briscoe |
170 |
| 2 |
159663 |
Ross Wece |
155 |
| 3 |
56503 |
Kevin J Holley |
141 |
Week 5
Lanier National Speedway
Dirt
- Total official races: 16
- Total drivers: 312
- Unique drivers: 136
- Highest SoF: 5,101
- Average SoF: 3,137
| # |
groupid |
Driver |
Points |
| 1 |
58176 |
Chase Briscoe |
235 |
| 2 |
97392 |
Matthew McKinney |
205 |
| 3 |
64259 |
Christopher Bell |
181 |
Week 6
Volusia Speedway Park
- Total official races: 8
- Total drivers: 167
- Unique drivers: 94
- Highest SoF: 3,891
- Average SoF: 2,772
| # |
groupid |
Driver |
Points |
| 1 |
64259 |
Christopher Bell |
178 |
| 2 |
58176 |
Chase Briscoe |
169 |
| 3 |
56503 |
Kevin J Holley |
160 |
- Total official races: 11
- Total drivers: 303
- Unique drivers: 148
- Highest SoF: 3,385
- Average SoF: 2,865
| # |
groupid |
Driver |
Points |
| 1 |
256268 |
Dustin Dougan |
164 |
| 2 |
119390 |
Anthony LoPresto |
156 |
| 3 |
56503 |
Kevin J Holley |
149 |
Week 8
Williams Grove Speedway
- Total official races: 2
- Total drivers: 40
- Unique drivers: 25
- Highest SoF: 4,057
- Average SoF: 3,977
| # |
groupid |
Driver |
Points |
| 1 |
58176 |
Chase Briscoe |
198 |
| 2 |
64259 |
Christopher Bell |
183 |
| 3 |
119390 |
Anthony LoPresto |
162 |
- Total official races: 12
- Total drivers: 303
- Unique drivers: 148
- Highest SoF: 4,621
- Average SoF: 3,087
| # |
groupid |
Driver |
Points |
| 1 |
58176 |
Chase Briscoe |
218 |
| 2 |
15583 |
Thomas Lewandowski |
177 |
| 3 |
270266 |
Todd Brandt |
159 |
Week 10
Lanier National Speedway
Dirt
- Total official races: 18
- Total drivers: 312
- Unique drivers: 136
- Highest SoF: 4,418
- Average SoF: 2,782
| # |
groupid |
Driver |
Points |
| 1 |
58176 |
Chase Briscoe |
223 |
| 2 |
119390 |
Anthony LoPresto |
180 |
| 3 |
236532 |
Dylan Schiebel |
173 |
Week 11
Volusia Speedway Park
- Total official races: 7
- Total drivers: 167
- Unique drivers: 94
- Highest SoF: 3,336
- Average SoF: 2,665
| # |
groupid |
Driver |
Points |
| 1 |
119390 |
Anthony LoPresto |
161 |
| 2 |
147945 |
John M LoPresto |
143 |
| 3 |
231510 |
Jesse Carr |
141 |
Week 12
Williams Grove Speedway
- Total official races: 0
- Total drivers: 40
- Unique drivers: 25
- Highest SoF: nan
- Average SoF: nan
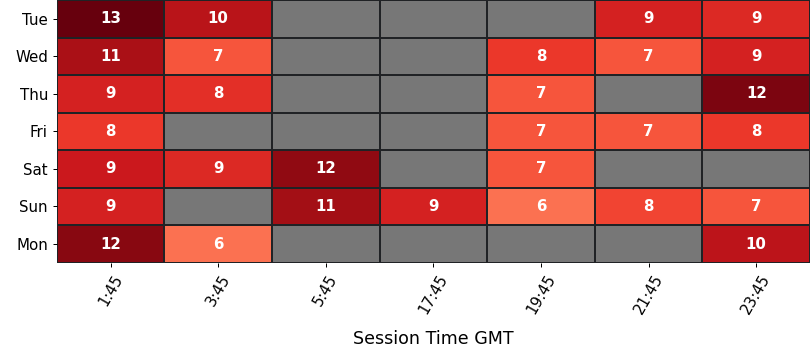
Historical Participation
Participation
average number of drivers in each time slot
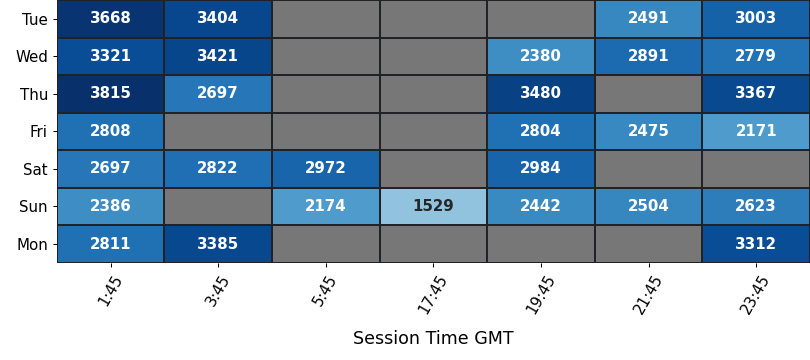
Strength of Field
average SoF of the top split for each time slot
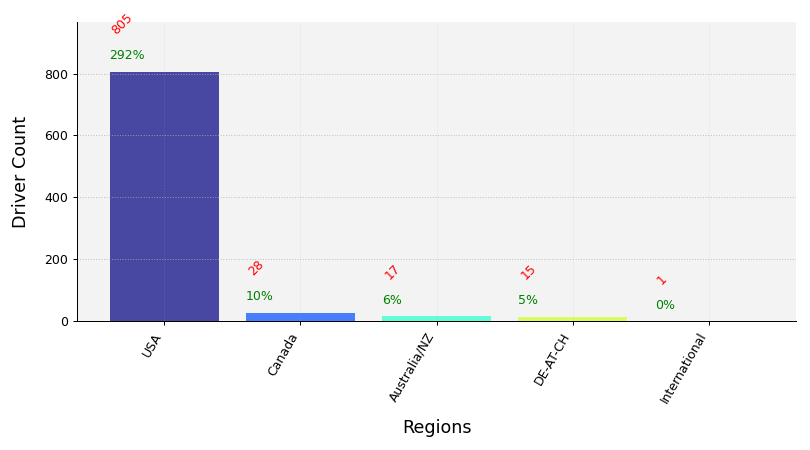
Clubs Distribution
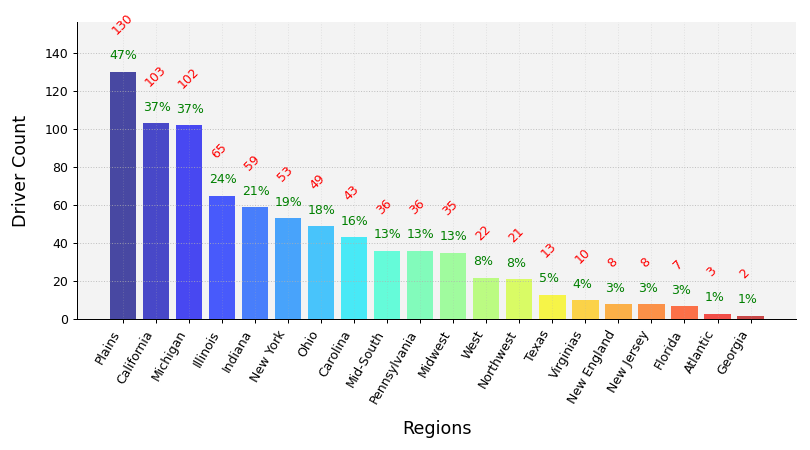
USA Clubs Distribution
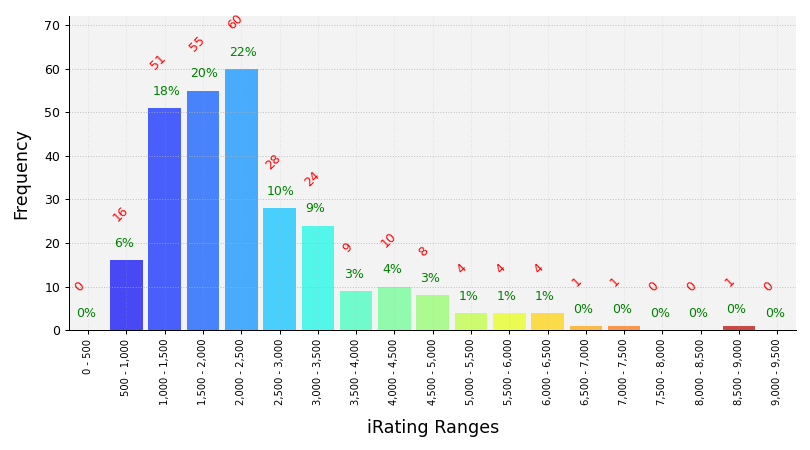
iRating Distribution
Championship Points
| # |
groupid |
Driver |
Points |
| 1 |
58176 |
Chase Briscoe |
1,499 |
| 2 |
56503 |
Kevin J Holley |
1,256 |
| 3 |
119390 |
Anthony LoPresto |
1,255 |
| 4 |
147945 |
John M LoPresto |
1,134 |
| 5 |
159663 |
Ross Wece |
1,070 |
Most Race Starts
| # |
groupid |
Driver |
Starts |
| 1 |
119390 |
Anthony LoPresto |
58 |
| 2 |
15583 |
Thomas Lewandowski |
41 |
| 3 |
147945 |
John M LoPresto |
33 |
| 4 |
56503 |
Kevin J Holley |
33 |
| 5 |
270266 |
Todd Brandt |
32 |
Grand Chelems
pole position, won race, fastest lap, led every lap (perfect if 0 inc)
| # |
groupid |
Driver |
Grand Chelems |
Chelem % |
Perfects |
| 1 |
119390 |
Anthony LoPresto |
19 |
29% |
17 |
| 2 |
15583 |
Thomas Lewandowski |
18 |
44% |
18 |
| 3 |
56503 |
Kevin J Holley |
5 |
15% |
5 |
| 4 |
58176 |
Chase Briscoe |
4 |
16% |
3 |
| 5 |
64259 |
Christopher Bell |
3 |
25% |
3 |
Average Finish Position
drivers must have raced 8 or more weeks to feature in this table
| # |
groupid |
Driver |
Avg Finish Pos |
Races |
| 1 |
119390 |
Anthony LoPresto |
2.4 |
58 |
| 2 |
58176 |
Chase Briscoe |
2.8 |
19 |
| 3 |
56503 |
Kevin J Holley |
3.3 |
33 |
| 4 |
15583 |
Thomas Lewandowski |
3.6 |
41 |
| 5 |
147945 |
John M LoPresto |
4.0 |
33 |
Most Wins
| # |
groupid |
Driver |
Wins |
| 1 |
119390 |
Anthony LoPresto |
27 |
| 2 |
15583 |
Thomas Lewandowski |
20 |
| 3 |
58176 |
Chase Briscoe |
13 |
| 4 |
56503 |
Kevin J Holley |
9 |
| 5 |
64259 |
Christopher Bell |
4 |
Most Podiums
| # |
groupid |
Driver |
Podiums |
| 1 |
119390 |
Anthony LoPresto |
50 |
| 2 |
15583 |
Thomas Lewandowski |
25 |
| 3 |
56503 |
Kevin J Holley |
22 |
| 4 |
147945 |
John M LoPresto |
20 |
| 5 |
270266 |
Todd Brandt |
15 |
Most Poles
| # |
groupid |
Driver |
Poles |
| 1 |
15583 |
Thomas Lewandowski |
29 |
| 2 |
119390 |
Anthony LoPresto |
25 |
| 3 |
56503 |
Kevin J Holley |
9 |
| 4 |
58176 |
Chase Briscoe |
7 |
| 5 |
64259 |
Christopher Bell |
5 |
Best Win Percentage
drivers must have raced 8 or more weeks to feature in this table
| # |
groupid |
Driver |
Win % |
Races |
| 1 |
58176 |
Chase Briscoe |
68% |
19 |
| 2 |
15583 |
Thomas Lewandowski |
49% |
41 |
| 3 |
119390 |
Anthony LoPresto |
47% |
58 |
| 4 |
56503 |
Kevin J Holley |
27% |
33 |
| 5 |
147945 |
John M LoPresto |
9% |
33 |
Best Podium Percentage
drivers must have raced 8 or more weeks to feature in this table
| # |
groupid |
Driver |
Podium % |
Races |
| 1 |
119390 |
Anthony LoPresto |
86% |
58 |
| 2 |
58176 |
Chase Briscoe |
74% |
19 |
| 3 |
56503 |
Kevin J Holley |
67% |
33 |
| 4 |
15583 |
Thomas Lewandowski |
61% |
41 |
| 5 |
147945 |
John M LoPresto |
61% |
33 |
Best Pole Percentage
drivers must have raced 8 or more weeks to feature in this table
| # |
groupid |
Driver |
Pole % |
Races |
| 1 |
15583 |
Thomas Lewandowski |
71% |
41 |
| 2 |
119390 |
Anthony LoPresto |
43% |
58 |
| 3 |
58176 |
Chase Briscoe |
37% |
19 |
| 4 |
56503 |
Kevin J Holley |
27% |
33 |
| 5 |
147945 |
John M LoPresto |
9% |
33 |
Best Average iRating Gains
drivers must have raced 8 or more weeks to feature in this table
| # |
groupid |
Team |
Avg iRating +/- |
Races |
| 1 |
58176 |
Chase Briscoe |
20 |
19 |
| 2 |
270266 |
Todd Brandt |
18 |
32 |
| 3 |
15583 |
Thomas Lewandowski |
14 |
41 |
| 4 |
159663 |
Ross Wece |
13 |
24 |
| 5 |
119390 |
Anthony LoPresto |
12 |
58 |
Highest Total iRating Gains
| # |
groupid |
Team |
iRating +/- |
Races |
| 1 |
119390 |
Anthony LoPresto |
711 |
58 |
| 2 |
15583 |
Thomas Lewandowski |
575 |
41 |
| 3 |
270266 |
Todd Brandt |
575 |
32 |
| 4 |
58176 |
Chase Briscoe |
389 |
19 |
| 5 |
56503 |
Kevin J Holley |
348 |
33 |
Cleanest Drivers
drivers must have raced 8 or more weeks to feature in this table
| # |
groupid |
Driver |
Inc / Corner |
| 1 |
15583 |
Thomas Lewandowski |
0.014 |
| 2 |
117884 |
Laura Gerhardt |
0.015 |
| 3 |
119390 |
Anthony LoPresto |
0.019 |
| 4 |
21318 |
Derek Rouse |
0.019 |
| 5 |
56503 |
Kevin J Holley |
0.021 |