ARCA Menards Series
2018 Season 1
- 6,174 unique drivers averaging 5.88 starts each.
- 258 drivers raced in 8 or more weeks.
- 1,895 official races with an average SOF of 1,731.
- 1,119,325 laps were completed with 185,788 incidents.
Week 1
Bristol Motor Speedway
Dual Pit Roads
- Total official races: 137
- Total drivers: 2,541
- Unique drivers: 1,174
- Highest SoF: 3,332
- Average SoF: 1,702
| # |
groupid |
Driver |
Points |
| 1 |
34809 |
Michael Guest |
182 |
| 2 |
155278 |
Brandon McKissic |
170 |
| 3 |
184301 |
Eric Stanford |
167 |
Week 2
Watkins Glen International
Boot
- Total official races: 82
- Total drivers: 1,313
- Unique drivers: 849
- Highest SoF: 4,105
- Average SoF: 1,843
| # |
groupid |
Driver |
Points |
| 1 |
58576 |
Cullen Brown |
219 |
| 2 |
125400 |
Bobby Zalenski |
206 |
| 3 |
63647 |
Gresham Wagner |
193 |
Week 3
Stafford Motor Speedway
Full Course
- Total official races: 100
- Total drivers: 1,687
- Unique drivers: 710
- Highest SoF: 3,659
- Average SoF: 1,847
| # |
groupid |
Driver |
Points |
| 1 |
33628 |
Paul Kusheba |
190 |
| 2 |
173787 |
Riley Stenjem |
185 |
| 3 |
18222 |
David Washington |
180 |
Week 4
South Boston Speedway
- Total official races: 160
- Total drivers: 3,021
- Unique drivers: 1,341
- Highest SoF: 3,361
- Average SoF: 1,689
| # |
groupid |
Driver |
Points |
| 1 |
151834 |
Michael Beamish |
191 |
| 2 |
194770 |
Garrett Manes |
180 |
| 3 |
156596 |
Michael Fenlason |
178 |
Week 5
Darlington Raceway
- Total official races: 94
- Total drivers: 1,625
- Unique drivers: 742
- Highest SoF: 3,164
- Average SoF: 1,865
| # |
groupid |
Driver |
Points |
| 1 |
100643 |
Ian T Smith |
167 |
| 2 |
33628 |
Paul Kusheba |
160 |
| 3 |
15780 |
Brian Schoenburg |
156 |
Week 6
Martinsville Speedway
- Total official races: 141
- Total drivers: 2,594
- Unique drivers: 1,094
- Highest SoF: 3,902
- Average SoF: 1,855
| # |
groupid |
Driver |
Points |
| 1 |
33628 |
Paul Kusheba |
221 |
| 2 |
19918 |
Michael Vaughn |
200 |
| 3 |
234821 |
Kaden Honeycutt |
199 |
Week 7
[Legacy] Daytona International Speedway - 2008
Oval
- Total official races: 397
- Total drivers: 8,570
- Unique drivers: 2,535
- Highest SoF: 4,368
- Average SoF: 1,679
| # |
groupid |
Driver |
Points |
| 1 |
101055 |
Zoltan Herczeg |
250 |
| 2 |
41210 |
Brad Patton |
234 |
| 3 |
19918 |
Michael Vaughn |
231 |
Week 8
Five Flags Speedway
- Total official races: 107
- Total drivers: 2,115
- Unique drivers: 853
- Highest SoF: 4,003
- Average SoF: 1,786
| # |
groupid |
Driver |
Points |
| 1 |
167354 |
Liam Brotherton |
211 |
| 2 |
143103 |
Ryan Doucette |
199 |
| 3 |
33628 |
Paul Kusheba |
186 |
Week 9
USA International Speedway
Asphalt
- Total official races: 191
- Total drivers: 3,731
- Unique drivers: 1,529
- Highest SoF: 3,743
- Average SoF: 1,663
| # |
groupid |
Driver |
Points |
| 1 |
124109 |
Tyler Ducharme |
211 |
| 2 |
174060 |
Colton Davis |
200 |
| 3 |
305601 |
Harrison Lyon |
195 |
- Total official races: 146
- Total drivers: 2,695
- Unique drivers: 1,173
- Highest SoF: 4,093
- Average SoF: 1,842
| # |
groupid |
Driver |
Points |
| 1 |
51005 |
Jarl Teien |
220 |
| 2 |
222922 |
Graham A. Bowlin |
204 |
| 3 |
260356 |
Steven Wilson3 |
203 |
Week 11
Thompson Speedway Motorsports Park
Oval
- Total official races: 138
- Total drivers: 2,481
- Unique drivers: 1,274
- Highest SoF: 3,347
- Average SoF: 1,591
| # |
groupid |
Driver |
Points |
| 1 |
143103 |
Ryan Doucette |
189 |
| 2 |
274385 |
Jim Mardis |
177 |
| 3 |
234821 |
Kaden Honeycutt |
174 |
Week 12
Atlanta Motor Speedway
Oval
- Total official races: 202
- Total drivers: 3,926
- Unique drivers: 1,654
- Highest SoF: 4,085
- Average SoF: 1,688
| # |
groupid |
Driver |
Points |
| 1 |
34809 |
Michael Guest |
213 |
| 2 |
88718 |
Kollin Keister |
202 |
| 3 |
222922 |
Graham A. Bowlin |
199 |
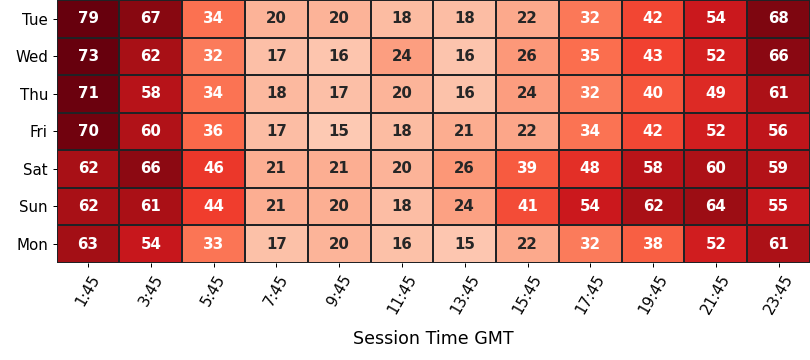
Participation
average number of drivers in each time slot
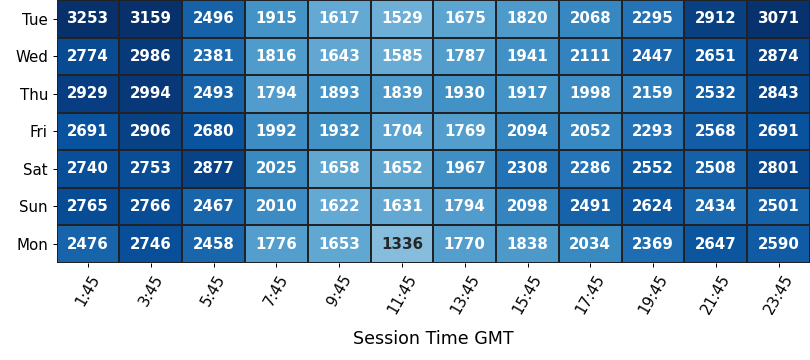
Strength of Field
average SoF of the top split for each time slot
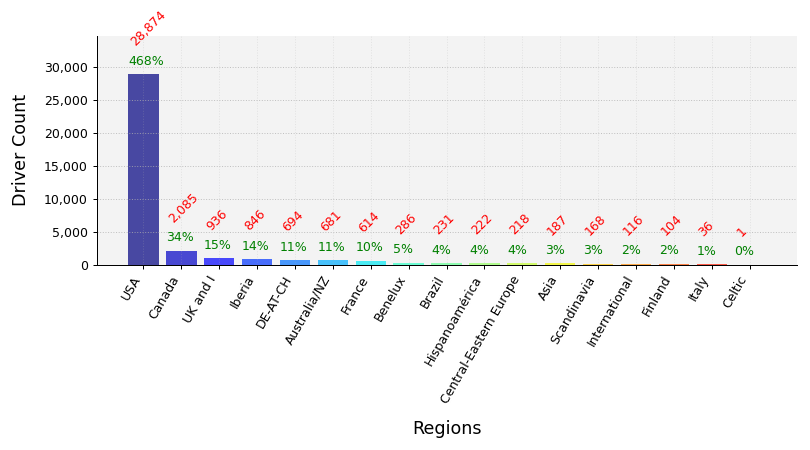
Clubs Distribution
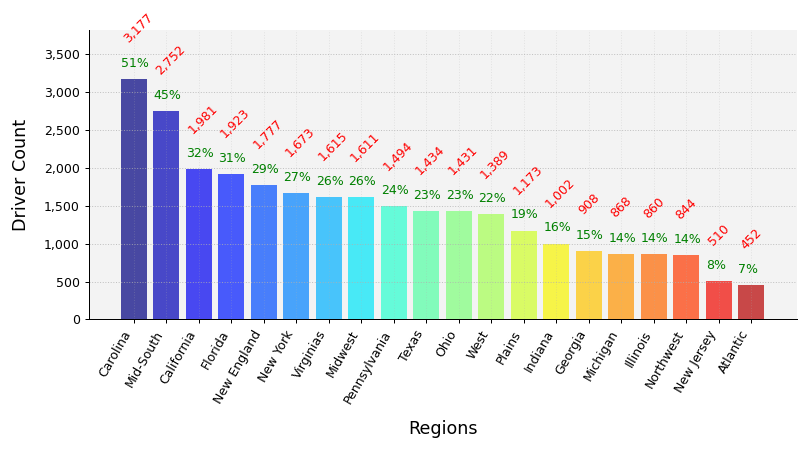
USA Clubs Distribution
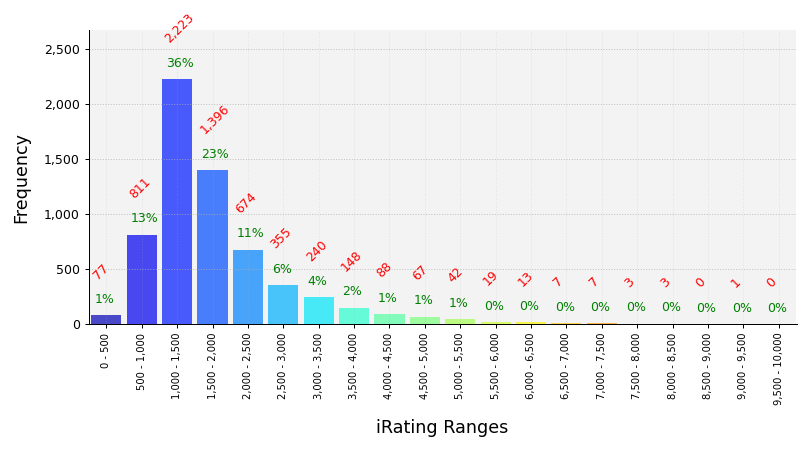
iRating Distribution
Championship Points
| # |
groupid |
Driver |
Points |
| 1 |
33628 |
Paul Kusheba |
1,521 |
| 2 |
19918 |
Michael Vaughn |
1,349 |
| 3 |
151834 |
Michael Beamish |
1,346 |
| 4 |
155457 |
Brett Fausey |
1,312 |
| 5 |
64155 |
Jason Hogan |
1,289 |
Most Race Starts
| # |
groupid |
Driver |
Starts |
| 1 |
306663 |
Ethan H Smith |
155 |
| 2 |
213534 |
Joseph Lepore |
155 |
| 3 |
142920 |
Lawrence Pollock |
142 |
| 4 |
85271 |
Jared Mogard |
113 |
| 5 |
58509 |
Connor Babel |
110 |
Grand Chelems
pole position, won race, fastest lap, led every lap (perfect if 0 inc)
| # |
groupid |
Driver |
Grand Chelems |
Chelem % |
Perfects |
| 1 |
234821 |
Kaden Honeycutt |
18 |
17% |
10 |
| 2 |
286074 |
Yuki Furuya |
16 |
29% |
15 |
| 3 |
143154 |
Leighton B Sibille |
14 |
9% |
6 |
| 4 |
222922 |
Graham A. Bowlin |
9 |
17% |
5 |
| 5 |
194770 |
Garrett Manes |
8 |
30% |
6 |
Average Finish Position
drivers must have raced 8 or more weeks to feature in this table
| # |
groupid |
Driver |
Avg Finish Pos |
Races |
| 1 |
100643 |
Ian T Smith |
3.5 |
18 |
| 2 |
143154 |
Leighton B Sibille |
3.9 |
67 |
| 3 |
33381 |
Alex Kan |
4.4 |
11 |
| 4 |
142840 |
Caeton Bomersbach |
4.6 |
14 |
| 5 |
255478 |
Hiroshi Shimizu |
4.9 |
14 |
Most Wins
| # |
groupid |
Driver |
Wins |
| 1 |
234821 |
Kaden Honeycutt |
25 |
| 2 |
143154 |
Leighton B Sibille |
25 |
| 3 |
58509 |
Connor Babel |
22 |
| 4 |
222922 |
Graham A. Bowlin |
21 |
| 5 |
286074 |
Yuki Furuya |
19 |
Most Podiums
| # |
groupid |
Driver |
Podiums |
| 1 |
143154 |
Leighton B Sibille |
46 |
| 2 |
306663 |
Ethan H Smith |
44 |
| 3 |
234821 |
Kaden Honeycutt |
39 |
| 4 |
85271 |
Jared Mogard |
39 |
| 5 |
58509 |
Connor Babel |
34 |
Most Poles
| # |
groupid |
Driver |
Poles |
| 1 |
234821 |
Kaden Honeycutt |
32 |
| 2 |
286074 |
Yuki Furuya |
27 |
| 3 |
143154 |
Leighton B Sibille |
22 |
| 4 |
58509 |
Connor Babel |
19 |
| 5 |
222922 |
Graham A. Bowlin |
19 |
Best Win Percentage
drivers must have raced 8 or more weeks to feature in this table
| # |
groupid |
Driver |
Win % |
Races |
| 1 |
33628 |
Paul Kusheba |
53% |
30 |
| 2 |
100643 |
Ian T Smith |
44% |
18 |
| 3 |
234821 |
Kaden Honeycutt |
42% |
60 |
| 4 |
143154 |
Leighton B Sibille |
37% |
67 |
| 5 |
80607 |
Joshua Johnston |
36% |
42 |
Best Podium Percentage
drivers must have raced 8 or more weeks to feature in this table
| # |
groupid |
Driver |
Podium % |
Races |
| 1 |
33381 |
Alex Kan |
82% |
11 |
| 2 |
100643 |
Ian T Smith |
72% |
18 |
| 3 |
143154 |
Leighton B Sibille |
69% |
67 |
| 4 |
33628 |
Paul Kusheba |
67% |
30 |
| 5 |
234821 |
Kaden Honeycutt |
65% |
60 |
Best Pole Percentage
drivers must have raced 8 or more weeks to feature in this table
| # |
groupid |
Driver |
Pole % |
Races |
| 1 |
234821 |
Kaden Honeycutt |
53% |
60 |
| 2 |
33628 |
Paul Kusheba |
47% |
30 |
| 3 |
139121 |
Memphis Villarreal |
41% |
22 |
| 4 |
33381 |
Alex Kan |
36% |
11 |
| 5 |
288695 |
Jeff D Merck |
35% |
20 |
Best Average iRating Gains
drivers must have raced 8 or more weeks to feature in this table
| # |
groupid |
Team |
Avg iRating +/- |
Races |
| 1 |
232821 |
Chris Baedorf |
42 |
17 |
| 2 |
115363 |
Steve Wright2 |
40 |
20 |
| 3 |
283971 |
Robbie Armstrong |
37 |
13 |
| 4 |
288246 |
Cory Johnson2 |
36 |
18 |
| 5 |
294349 |
Giovanni Romano |
32 |
10 |
Highest Total iRating Gains
| # |
groupid |
Team |
iRating +/- |
Races |
| 1 |
155383 |
Will Rodgers |
2,015 |
65 |
| 2 |
306663 |
Ethan H Smith |
1,856 |
155 |
| 3 |
213534 |
Joseph Lepore |
1,492 |
155 |
| 4 |
246012 |
Amy Schwichtenberg |
1,366 |
56 |
| 5 |
302188 |
Reggie Ortega |
1,262 |
63 |
Cleanest Drivers
drivers must have raced 8 or more weeks to feature in this table
| # |
groupid |
Driver |
Inc / Corner |
| 1 |
16083 |
Brett Stephens |
0.002 |
| 2 |
92069 |
Andrew Schwartz |
0.003 |
| 3 |
186445 |
Jason M Hughes |
0.009 |
| 4 |
37204 |
Jeff Johnson |
0.010 |
| 5 |
266653 |
Matt Roseland |
0.010 |