10 Years of the Late Model
2018 Season 3
- 1,457 unique drivers averaging 2.18 starts each.
- 68 drivers raced in 4 or more weeks.
- 280 official races with an average SOF of 1,892.
- 68,956 laps were completed with 9,249 incidents.
Week 1
USA International Speedway
Asphalt
- Total official races: 67
- Total drivers: 815
- Unique drivers: 560
- Highest SoF: 4,592
- Average SoF: 1,819
| # |
groupid |
Driver |
Points |
| 1 |
251202 |
Alex McCollum3 |
245 |
| 2 |
166376 |
Collin Slife |
210 |
| 3 |
155936 |
Chris Silvestri |
198 |
Week 2
South Boston Speedway
- Total official races: 46
- Total drivers: 525
- Unique drivers: 365
- Highest SoF: 3,711
- Average SoF: 1,817
| # |
groupid |
Driver |
Points |
| 1 |
251202 |
Alex McCollum3 |
184 |
| 2 |
179160 |
Jeff Mills |
165 |
| 3 |
43428 |
Eric W Purcell |
161 |
- Total official races: 30
- Total drivers: 321
- Unique drivers: 242
- Highest SoF: 2,742
- Average SoF: 1,750
| # |
groupid |
Driver |
Points |
| 1 |
80750 |
Jonathan Kornegay |
153 |
| 2 |
209007 |
Josh Langille |
142 |
| 3 |
155936 |
Chris Silvestri |
132 |
Week 4
Stafford Motor Speedway
Full Course
- Total official races: 17
- Total drivers: 161
- Unique drivers: 116
- Highest SoF: 3,862
- Average SoF: 1,900
| # |
groupid |
Driver |
Points |
| 1 |
251202 |
Alex McCollum3 |
184 |
| 2 |
96381 |
Andrew Simmons |
163 |
| 3 |
173037 |
Phillip Temples |
161 |
Week 5
Martinsville Speedway
- Total official races: 37
- Total drivers: 407
- Unique drivers: 283
- Highest SoF: 4,213
- Average SoF: 2,092
| # |
groupid |
Driver |
Points |
| 1 |
251202 |
Alex McCollum3 |
211 |
| 2 |
88718 |
Kollin Keister |
189 |
| 3 |
265916 |
Drew Wooten |
179 |
Week 6
Lanier National Speedway
Asphalt
- Total official races: 46
- Total drivers: 544
- Unique drivers: 340
- Highest SoF: 3,840
- Average SoF: 1,805
| # |
groupid |
Driver |
Points |
| 1 |
138937 |
William Hale |
193 |
| 2 |
111238 |
Dalton Collins |
171 |
| 3 |
270352 |
Chad J Frankenfield |
161 |
Week 7
Irwindale Speedway
Outer
- Total official races: 37
- Total drivers: 409
- Unique drivers: 223
- Highest SoF: 3,999
- Average SoF: 2,137
| # |
groupid |
Driver |
Points |
| 1 |
265916 |
Drew Wooten |
185 |
| 2 |
35224 |
Dustin Bolgrihn |
176 |
| 3 |
138937 |
William Hale |
166 |
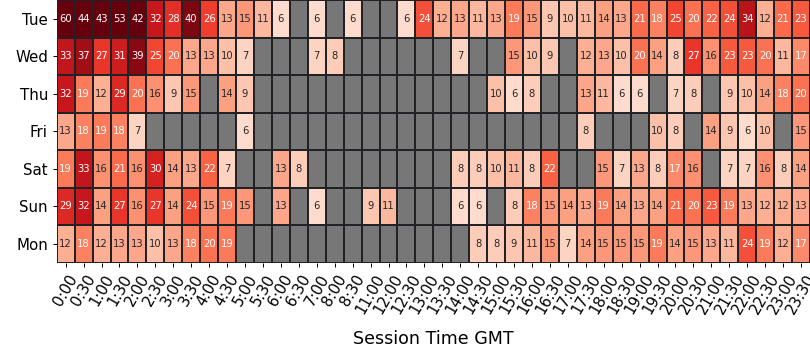
Participation
average number of drivers in each time slot
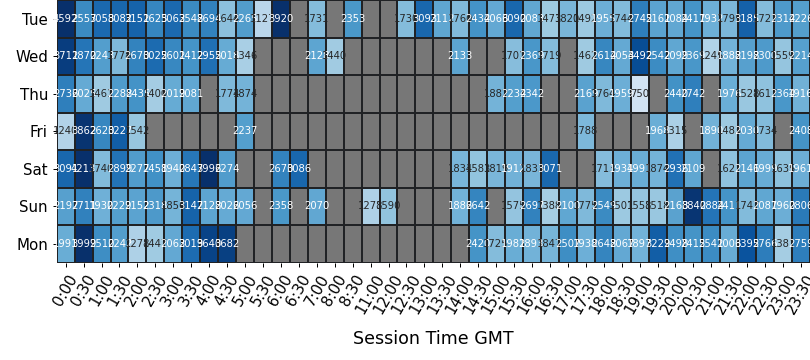
Strength of Field
average SoF of the top split for each time slot
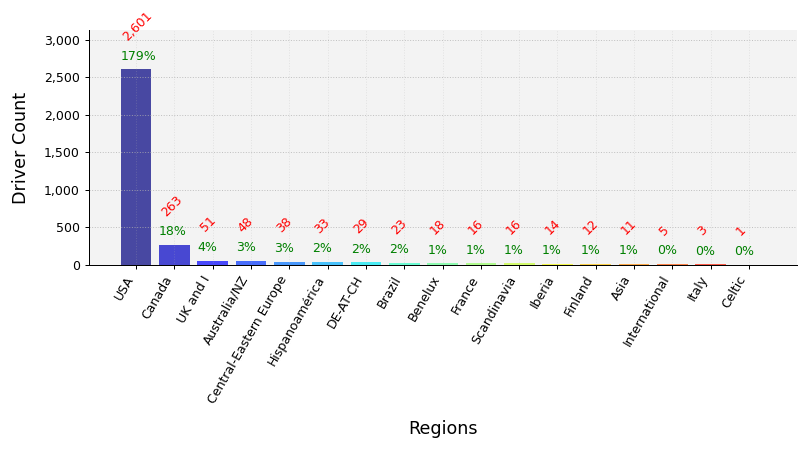
Clubs Distribution
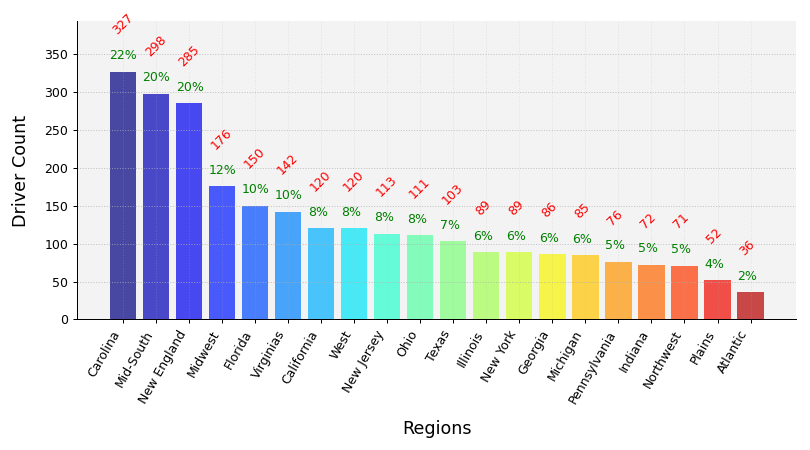
USA Clubs Distribution
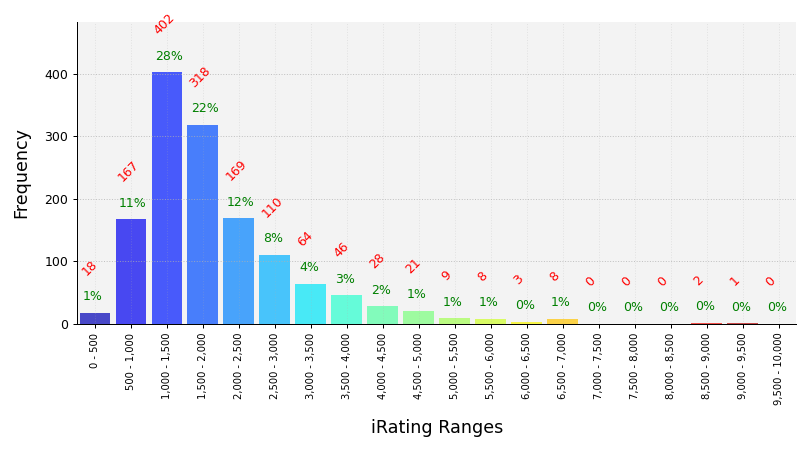
iRating Distribution
Championship Points
| # |
groupid |
Driver |
Points |
| 1 |
251202 |
Alex McCollum3 |
824 |
| 2 |
265916 |
Drew Wooten |
672 |
| 3 |
155936 |
Chris Silvestri |
662 |
| 4 |
173037 |
Phillip Temples |
597 |
| 5 |
179160 |
Jeff Mills |
591 |
Most Race Starts
| # |
groupid |
Driver |
Starts |
| 1 |
225293 |
E J Lally |
39 |
| 2 |
179160 |
Jeff Mills |
39 |
| 3 |
215126 |
Bill Eberhardt |
31 |
| 4 |
332889 |
Travis Bushley |
29 |
| 5 |
155936 |
Chris Silvestri |
23 |
Grand Chelems
pole position, won race, fastest lap, led every lap (perfect if 0 inc)
| # |
groupid |
Driver |
Grand Chelems |
Chelem % |
Perfects |
| 1 |
265916 |
Drew Wooten |
7 |
43% |
6 |
| 2 |
155936 |
Chris Silvestri |
6 |
17% |
4 |
| 3 |
17070 |
Tyler D Hudson |
5 |
100% |
5 |
| 4 |
251202 |
Alex McCollum3 |
5 |
38% |
5 |
| 5 |
179160 |
Jeff Mills |
5 |
13% |
5 |
Average Finish Position
drivers must have raced 4 or more weeks to feature in this table
| # |
groupid |
Driver |
Avg Finish Pos |
Races |
| 1 |
251202 |
Alex McCollum3 |
1.4 |
13 |
| 2 |
265916 |
Drew Wooten |
2.1 |
14 |
| 3 |
96381 |
Andrew Simmons |
2.5 |
10 |
| 4 |
173037 |
Phillip Temples |
2.7 |
10 |
| 5 |
205900 |
John Hans |
2.7 |
7 |
Most Wins
| # |
groupid |
Driver |
Wins |
| 1 |
265916 |
Drew Wooten |
10 |
| 2 |
155936 |
Chris Silvestri |
10 |
| 3 |
251202 |
Alex McCollum3 |
9 |
| 4 |
179160 |
Jeff Mills |
8 |
| 5 |
52934 |
Brandon Wilkinson |
7 |
Most Podiums
| # |
groupid |
Driver |
Podiums |
| 1 |
179160 |
Jeff Mills |
30 |
| 2 |
225293 |
E J Lally |
21 |
| 3 |
127976 |
Sergio Abella |
17 |
| 4 |
155936 |
Chris Silvestri |
17 |
| 5 |
251202 |
Alex McCollum3 |
13 |
Most Poles
| # |
groupid |
Driver |
Poles |
| 1 |
251202 |
Alex McCollum3 |
10 |
| 2 |
155936 |
Chris Silvestri |
10 |
| 3 |
179160 |
Jeff Mills |
10 |
| 4 |
265916 |
Drew Wooten |
7 |
| 5 |
52934 |
Brandon Wilkinson |
5 |
Best Win Percentage
drivers must have raced 4 or more weeks to feature in this table
| # |
groupid |
Driver |
Win % |
Races |
| 1 |
265916 |
Drew Wooten |
71% |
14 |
| 2 |
251202 |
Alex McCollum3 |
69% |
13 |
| 3 |
96381 |
Andrew Simmons |
50% |
10 |
| 4 |
155936 |
Chris Silvestri |
43% |
23 |
| 5 |
173037 |
Phillip Temples |
40% |
10 |
Best Podium Percentage
drivers must have raced 4 or more weeks to feature in this table
| # |
groupid |
Driver |
Podium % |
Races |
| 1 |
251202 |
Alex McCollum3 |
100% |
13 |
| 2 |
334360 |
Gary Cronenwett |
88% |
8 |
| 3 |
96381 |
Andrew Simmons |
80% |
10 |
| 4 |
167181 |
Blake Gordon |
80% |
10 |
| 5 |
265916 |
Drew Wooten |
79% |
14 |
Best Pole Percentage
drivers must have raced 4 or more weeks to feature in this table
| # |
groupid |
Driver |
Pole % |
Races |
| 1 |
251202 |
Alex McCollum3 |
77% |
13 |
| 2 |
265916 |
Drew Wooten |
50% |
14 |
| 3 |
155936 |
Chris Silvestri |
43% |
23 |
| 4 |
21658 |
Carmen Comeau |
40% |
5 |
| 5 |
231497 |
James Yurs |
33% |
6 |
Best Average iRating Gains
drivers must have raced 4 or more weeks to feature in this table
| # |
groupid |
Team |
Avg iRating +/- |
Races |
| 1 |
80750 |
Jonathan Kornegay |
64 |
6 |
| 2 |
173037 |
Phillip Temples |
62 |
10 |
| 3 |
231497 |
James Yurs |
62 |
6 |
| 4 |
30326 |
Lewis King |
60 |
7 |
| 5 |
272768 |
Zak Habeck |
58 |
10 |
Highest Total iRating Gains
| # |
groupid |
Team |
iRating +/- |
Races |
| 1 |
179160 |
Jeff Mills |
926 |
39 |
| 2 |
312711 |
Willy Evernham |
668 |
17 |
| 3 |
173037 |
Phillip Temples |
623 |
10 |
| 4 |
272768 |
Zak Habeck |
578 |
10 |
| 5 |
162844 |
Shawn Miner |
561 |
21 |
Cleanest Drivers
drivers must have raced 4 or more weeks to feature in this table
| # |
groupid |
Driver |
Inc / Corner |
| 1 |
149679 |
Richard Christjohn |
0.000 |
| 2 |
182030 |
Matthew Katila |
0.004 |
| 3 |
231497 |
James Yurs |
0.009 |
| 4 |
179160 |
Jeff Mills |
0.009 |
| 5 |
142174 |
Paul Morgan Jr |
0.009 |