10 Years of the Legends
2018 Season 3
- 2,560 unique drivers averaging 2.22 starts each.
- 113 drivers raced in 4 or more weeks.
- 470 official races with an average SOF of 1,428.
- 116,212 laps were completed with 20,345 incidents.
Week 1
Lanier National Speedway
Asphalt
- Total official races: 54
- Total drivers: 703
- Unique drivers: 503
- Highest SoF: 4,674
- Average SoF: 1,542
| # |
groupid |
Driver |
Points |
| 1 |
107777 |
Ryan Kuhn |
240 |
| 2 |
155936 |
Chris Silvestri |
207 |
| 3 |
265916 |
Drew Wooten |
199 |
Week 2
Oxford Plains Speedway
- Total official races: 83
- Total drivers: 962
- Unique drivers: 632
- Highest SoF: 3,729
- Average SoF: 1,392
| # |
groupid |
Driver |
Points |
| 1 |
107777 |
Ryan Kuhn |
192 |
| 2 |
251202 |
Alex McCollum3 |
177 |
| 3 |
33628 |
Paul Kusheba |
166 |
Week 3
South Boston Speedway
- Total official races: 92
- Total drivers: 1,179
- Unique drivers: 701
- Highest SoF: 3,779
- Average SoF: 1,375
| # |
groupid |
Driver |
Points |
| 1 |
33628 |
Paul Kusheba |
196 |
| 2 |
107777 |
Ryan Kuhn |
192 |
| 3 |
192530 |
Jeffery Martin |
177 |
Week 4
[Legacy] Charlotte Motor Speedway - 2008
Legends Oval
- Total official races: 61
- Total drivers: 692
- Unique drivers: 488
- Highest SoF: 4,191
- Average SoF: 1,412
| # |
groupid |
Driver |
Points |
| 1 |
113432 |
Connor Younginer |
217 |
| 2 |
83087 |
Zach Leonhardi |
198 |
| 3 |
176271 |
Ricky Springer |
180 |
Week 5
USA International Speedway
Asphalt
- Total official races: 85
- Total drivers: 1,048
- Unique drivers: 640
- Highest SoF: 3,372
- Average SoF: 1,305
| # |
groupid |
Driver |
Points |
| 1 |
107777 |
Ryan Kuhn |
175 |
| 2 |
197648 |
Kenny Brady |
153 |
| 3 |
284587 |
Malachi Drake |
150 |
- Total official races: 70
- Total drivers: 852
- Unique drivers: 546
- Highest SoF: 3,529
- Average SoF: 1,331
| # |
groupid |
Driver |
Points |
| 1 |
251202 |
Alex McCollum3 |
183 |
| 2 |
265916 |
Drew Wooten |
173 |
| 3 |
40298 |
Bruce Bennett |
169 |
Week 7
Irwindale Speedway
Outer
- Total official races: 25
- Total drivers: 251
- Unique drivers: 200
- Highest SoF: 4,693
- Average SoF: 2,233
| # |
groupid |
Driver |
Points |
| 1 |
251202 |
Alex McCollum3 |
220 |
| 2 |
107777 |
Ryan Kuhn |
192 |
| 3 |
234452 |
Blake Near |
165 |
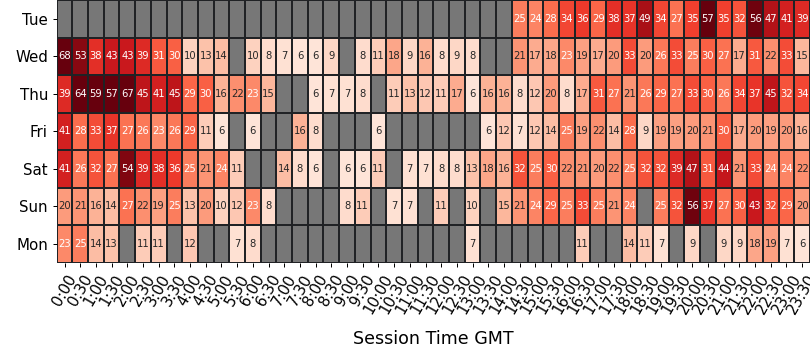
Participation
average number of drivers in each time slot
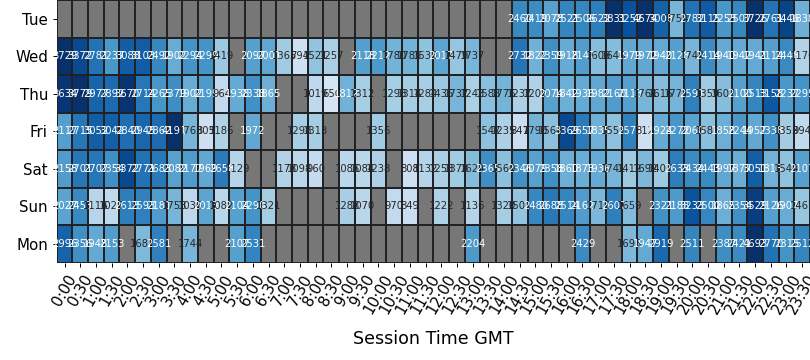
Strength of Field
average SoF of the top split for each time slot
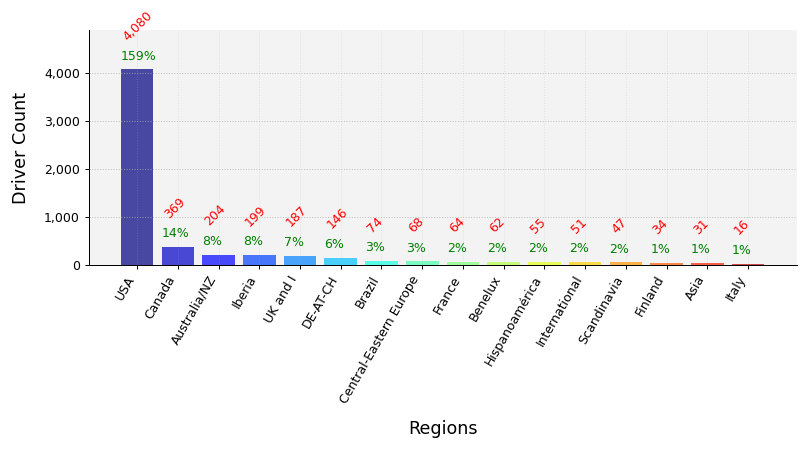
Clubs Distribution
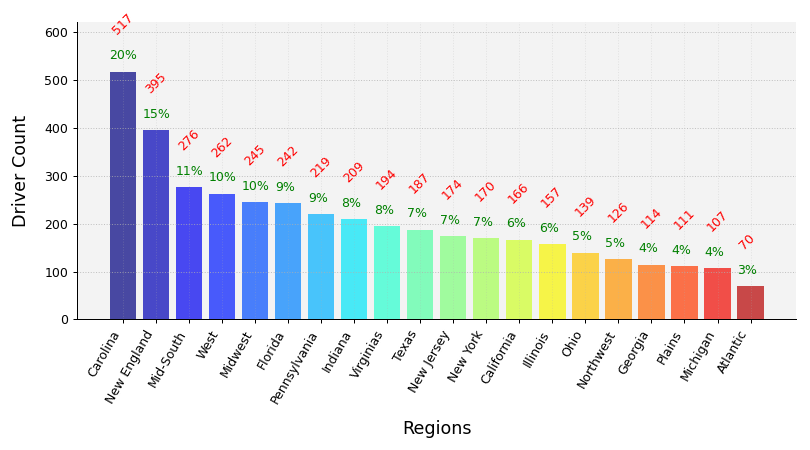
USA Clubs Distribution
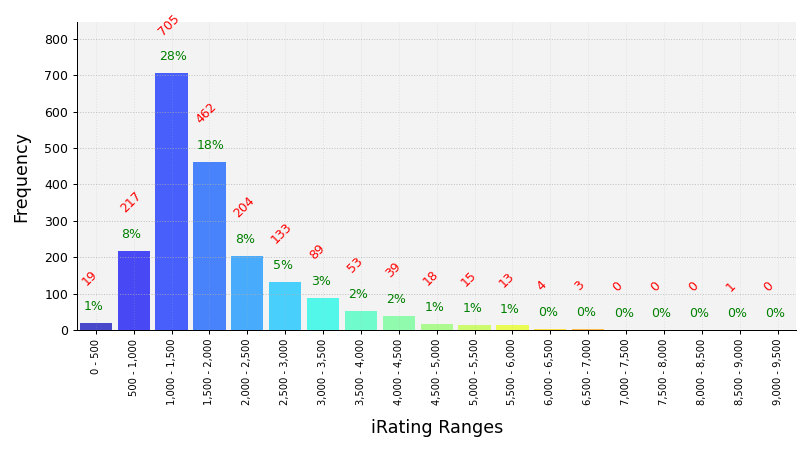
iRating Distribution
Championship Points
| # |
groupid |
Driver |
Points |
| 1 |
107777 |
Ryan Kuhn |
816 |
| 2 |
251202 |
Alex McCollum3 |
751 |
| 3 |
265916 |
Drew Wooten |
660 |
| 4 |
155936 |
Chris Silvestri |
600 |
| 5 |
208765 |
Mark A Mitchem |
562 |
Most Race Starts
| # |
groupid |
Driver |
Starts |
| 1 |
215126 |
Bill Eberhardt |
94 |
| 2 |
325611 |
Howard Hodge |
75 |
| 3 |
251202 |
Alex McCollum3 |
32 |
| 4 |
319635 |
Timothy Altman |
30 |
| 5 |
192983 |
Ean Martin |
30 |
Grand Chelems
pole position, won race, fastest lap, led every lap (perfect if 0 inc)
| # |
groupid |
Driver |
Grand Chelems |
Chelem % |
Perfects |
| 1 |
251202 |
Alex McCollum3 |
12 |
31% |
10 |
| 2 |
178325 |
Ryan J Kuhn |
7 |
28% |
5 |
| 3 |
197648 |
Kenny Brady |
7 |
17% |
5 |
| 4 |
107404 |
Seth Frazier |
6 |
40% |
6 |
| 5 |
107777 |
Ryan Kuhn |
6 |
30% |
6 |
Average Finish Position
drivers must have raced 4 or more weeks to feature in this table
| # |
groupid |
Driver |
Avg Finish Pos |
Races |
| 1 |
133198 |
Darrell Stewart |
1.6 |
7 |
| 2 |
234452 |
Blake Near |
2.2 |
13 |
| 3 |
197648 |
Kenny Brady |
2.5 |
29 |
| 4 |
183567 |
Péter Balassa |
2.7 |
7 |
| 5 |
332140 |
William Hairston |
2.7 |
7 |
Most Wins
| # |
groupid |
Driver |
Wins |
| 1 |
251202 |
Alex McCollum3 |
20 |
| 2 |
197648 |
Kenny Brady |
15 |
| 3 |
107777 |
Ryan Kuhn |
11 |
| 4 |
234452 |
Blake Near |
9 |
| 5 |
107404 |
Seth Frazier |
9 |
Most Podiums
| # |
groupid |
Driver |
Podiums |
| 1 |
251202 |
Alex McCollum3 |
27 |
| 2 |
197648 |
Kenny Brady |
24 |
| 3 |
192983 |
Ean Martin |
22 |
| 4 |
107777 |
Ryan Kuhn |
17 |
| 5 |
238054 |
David Rodriguez Cabanillas |
16 |
Most Poles
| # |
groupid |
Driver |
Poles |
| 1 |
251202 |
Alex McCollum3 |
17 |
| 2 |
197648 |
Kenny Brady |
15 |
| 3 |
335818 |
Tyler Carey2 |
12 |
| 4 |
107777 |
Ryan Kuhn |
11 |
| 5 |
178325 |
Ryan J Kuhn |
8 |
Best Win Percentage
drivers must have raced 4 or more weeks to feature in this table
| # |
groupid |
Driver |
Win % |
Races |
| 1 |
133198 |
Darrell Stewart |
71% |
7 |
| 2 |
332140 |
William Hairston |
71% |
7 |
| 3 |
234452 |
Blake Near |
69% |
13 |
| 4 |
251202 |
Alex McCollum3 |
62% |
32 |
| 5 |
107777 |
Ryan Kuhn |
55% |
20 |
Best Podium Percentage
drivers must have raced 4 or more weeks to feature in this table
| # |
groupid |
Driver |
Podium % |
Races |
| 1 |
234452 |
Blake Near |
92% |
13 |
| 2 |
133198 |
Darrell Stewart |
86% |
7 |
| 3 |
332140 |
William Hairston |
86% |
7 |
| 4 |
183567 |
Péter Balassa |
86% |
7 |
| 5 |
107777 |
Ryan Kuhn |
85% |
20 |
Best Pole Percentage
drivers must have raced 4 or more weeks to feature in this table
| # |
groupid |
Driver |
Pole % |
Races |
| 1 |
332140 |
William Hairston |
71% |
7 |
| 2 |
133198 |
Darrell Stewart |
57% |
7 |
| 3 |
335818 |
Tyler Carey2 |
55% |
22 |
| 4 |
107777 |
Ryan Kuhn |
55% |
20 |
| 5 |
234452 |
Blake Near |
54% |
13 |
Best Average iRating Gains
drivers must have raced 4 or more weeks to feature in this table
| # |
groupid |
Team |
Avg iRating +/- |
Races |
| 1 |
133198 |
Darrell Stewart |
82 |
7 |
| 2 |
326891 |
Grayson Ward |
64 |
9 |
| 3 |
30763 |
Geary Rinehimer2 |
57 |
9 |
| 4 |
88596 |
James Fremont |
57 |
7 |
| 5 |
183567 |
Péter Balassa |
50 |
7 |
Highest Total iRating Gains
| # |
groupid |
Team |
iRating +/- |
Races |
| 1 |
197648 |
Kenny Brady |
1,179 |
29 |
| 2 |
107404 |
Seth Frazier |
1,105 |
15 |
| 3 |
319635 |
Timothy Altman |
921 |
30 |
| 4 |
238054 |
David Rodriguez Cabanillas |
888 |
27 |
| 5 |
301530 |
Jason Menda |
833 |
23 |
Cleanest Drivers
drivers must have raced 4 or more weeks to feature in this table
| # |
groupid |
Driver |
Inc / Corner |
| 1 |
267538 |
Eric Salyers |
0.000 |
| 2 |
292835 |
Michael Scurlock |
0.000 |
| 3 |
314589 |
Dylan Hale2 |
0.000 |
| 4 |
311456 |
Mathew Geering |
0.008 |
| 5 |
96381 |
Andrew Simmons |
0.009 |