Advanced Legends Cup
2018 Season 3
- 6,948 unique drivers averaging 5.17 starts each.
- 212 drivers raced in 8 or more weeks.
- 3,263 official races with an average SOF of 1,186.
- 1,027,555 laps were completed with 161,155 incidents.
Week 1
[Legacy] Charlotte Motor Speedway - 2008
Legends Oval
- Total official races: 190
- Total drivers: 4,675
- Unique drivers: 1,884
- Highest SoF: 4,091
- Average SoF: 1,205
| # |
groupid |
Driver |
Points |
| 1 |
107777 |
Ryan Kuhn |
190 |
| 2 |
54614 |
Bryan Narducci |
155 |
| 3 |
145544 |
Max J Cookson |
154 |
Week 2
Oxford Plains Speedway
- Total official races: 217
- Total drivers: 2,201
- Unique drivers: 995
- Highest SoF: 4,217
- Average SoF: 1,283
| # |
groupid |
Driver |
Points |
| 1 |
107777 |
Ryan Kuhn |
194 |
| 2 |
251202 |
Alex McCollum3 |
163 |
| 3 |
77834 |
Jim George |
152 |
Week 3
USA International Speedway
Asphalt
- Total official races: 292
- Total drivers: 7,329
- Unique drivers: 2,406
- Highest SoF: 3,682
- Average SoF: 1,185
| # |
groupid |
Driver |
Points |
| 1 |
183291 |
Jonathan McKenzie2 |
178 |
| 2 |
142876 |
Johnny Dressler |
155 |
| 3 |
320140 |
Riley J Stenjem |
151 |
Week 4
South Boston Speedway
- Total official races: 283
- Total drivers: 5,645
- Unique drivers: 1,996
- Highest SoF: 3,004
- Average SoF: 1,176
| # |
groupid |
Driver |
Points |
| 1 |
70900 |
William Turner2 |
147 |
| 2 |
251202 |
Alex McCollum3 |
144 |
| 3 |
173787 |
Riley Stenjem |
144 |
Week 5
Thompson Speedway Motorsports Park
Oval
- Total official races: 303
- Total drivers: 6,915
- Unique drivers: 2,322
- Highest SoF: 3,924
- Average SoF: 1,149
| # |
groupid |
Driver |
Points |
| 1 |
107777 |
Ryan Kuhn |
201 |
| 2 |
48893 |
Cole V Cabre |
169 |
| 3 |
265916 |
Drew Wooten |
164 |
Week 6
Lanier National Speedway
Asphalt
- Total official races: 293
- Total drivers: 6,463
- Unique drivers: 2,241
- Highest SoF: 3,770
- Average SoF: 1,215
| # |
groupid |
Driver |
Points |
| 1 |
145544 |
Max J Cookson |
183 |
| 2 |
251202 |
Alex McCollum3 |
173 |
| 3 |
234918 |
Devin Curl |
162 |
Week 7
[Legacy] Charlotte Motor Speedway - 2008
Legends Oval
- Total official races: 251
- Total drivers: 4,675
- Unique drivers: 1,884
- Highest SoF: 3,676
- Average SoF: 1,133
| # |
groupid |
Driver |
Points |
| 1 |
107777 |
Ryan Kuhn |
168 |
| 2 |
307392 |
Chris Carroll3 |
160 |
| 3 |
251202 |
Alex McCollum3 |
158 |
- Total official races: 245
- Total drivers: 2,687
- Unique drivers: 1,084
- Highest SoF: 4,104
- Average SoF: 1,224
| # |
groupid |
Driver |
Points |
| 1 |
251202 |
Alex McCollum3 |
182 |
| 2 |
107777 |
Ryan Kuhn |
173 |
| 3 |
102579 |
Derek Gluchacki |
172 |
Week 9
USA International Speedway
Asphalt
- Total official races: 357
- Total drivers: 7,329
- Unique drivers: 2,406
- Highest SoF: 3,595
- Average SoF: 1,146
| # |
groupid |
Driver |
Points |
| 1 |
251202 |
Alex McCollum3 |
166 |
| 2 |
307392 |
Chris Carroll3 |
159 |
| 3 |
73734 |
Christopher Shockley |
155 |
Week 10
South Boston Speedway
- Total official races: 233
- Total drivers: 5,645
- Unique drivers: 1,996
- Highest SoF: 3,790
- Average SoF: 1,236
| # |
groupid |
Driver |
Points |
| 1 |
107777 |
Ryan Kuhn |
169 |
| 2 |
251202 |
Alex McCollum3 |
165 |
| 3 |
303148 |
Parker Brookfield |
160 |
Week 11
Thompson Speedway Motorsports Park
Oval
- Total official races: 312
- Total drivers: 6,915
- Unique drivers: 2,322
- Highest SoF: 3,371
- Average SoF: 1,099
| # |
groupid |
Driver |
Points |
| 1 |
107777 |
Ryan Kuhn |
177 |
| 2 |
214784 |
Tyler Cox |
159 |
| 3 |
143103 |
Ryan Doucette |
159 |
Week 12
Lanier National Speedway
Asphalt
- Total official races: 287
- Total drivers: 6,463
- Unique drivers: 2,241
- Highest SoF: 4,064
- Average SoF: 1,243
| # |
groupid |
Driver |
Points |
| 1 |
251202 |
Alex McCollum3 |
199 |
| 2 |
145544 |
Max J Cookson |
196 |
| 3 |
107777 |
Ryan Kuhn |
193 |
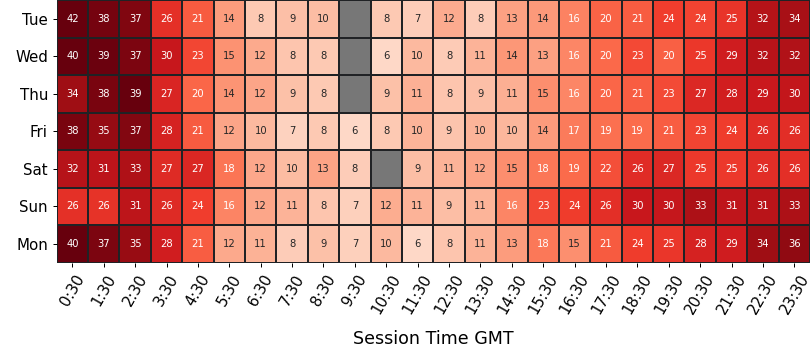
Participation
average number of drivers in each time slot
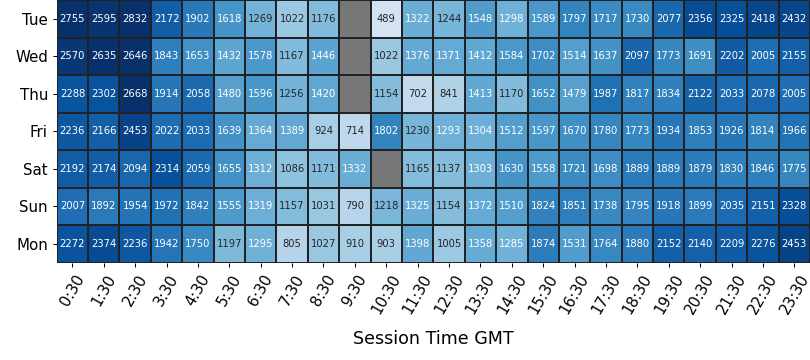
Strength of Field
average SoF of the top split for each time slot
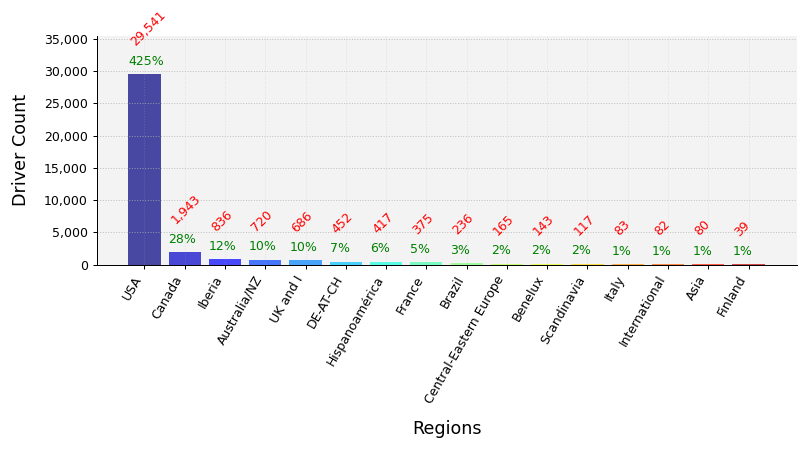
Clubs Distribution
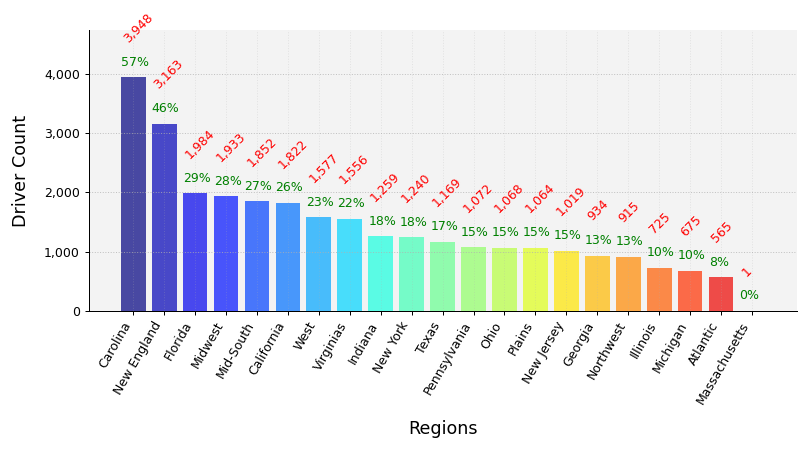
USA Clubs Distribution
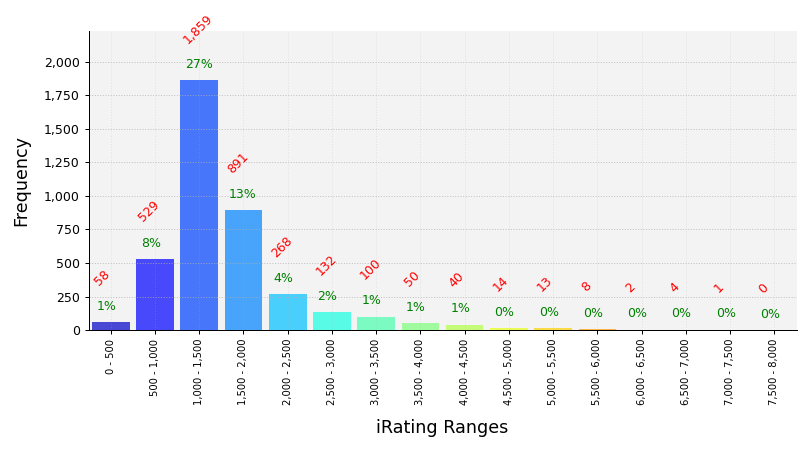
iRating Distribution
Championship Points
| # |
groupid |
Driver |
Points |
| 1 |
107777 |
Ryan Kuhn |
1,465 |
| 2 |
251202 |
Alex McCollum3 |
1,363 |
| 3 |
145544 |
Max J Cookson |
1,188 |
| 4 |
307392 |
Chris Carroll3 |
1,181 |
| 5 |
214784 |
Tyler Cox |
1,137 |
Most Race Starts
| # |
groupid |
Driver |
Starts |
| 1 |
306496 |
Jay Hicks |
198 |
| 2 |
326857 |
Andy Ashley |
165 |
| 3 |
270282 |
Mike Davis2 |
165 |
| 4 |
249204 |
Chris Tillman |
160 |
| 5 |
281289 |
Levi Brown |
148 |
Grand Chelems
pole position, won race, fastest lap, led every lap (perfect if 0 inc)
| # |
groupid |
Driver |
Grand Chelems |
Chelem % |
Perfects |
| 1 |
145544 |
Max J Cookson |
49 |
26% |
35 |
| 2 |
30428 |
Tate Scharf |
48 |
51% |
44 |
| 3 |
307392 |
Chris Carroll3 |
39 |
36% |
35 |
| 4 |
303148 |
Parker Brookfield |
39 |
34% |
28 |
| 5 |
306496 |
Jay Hicks |
31 |
8% |
16 |
Average Finish Position
drivers must have raced 8 or more weeks to feature in this table
| # |
groupid |
Driver |
Avg Finish Pos |
Races |
| 1 |
107777 |
Ryan Kuhn |
1.1 |
34 |
| 2 |
30428 |
Tate Scharf |
1.6 |
87 |
| 3 |
251202 |
Alex McCollum3 |
1.8 |
71 |
| 4 |
303148 |
Parker Brookfield |
1.9 |
83 |
| 5 |
307392 |
Chris Carroll3 |
1.9 |
98 |
Most Wins
| # |
groupid |
Driver |
Wins |
| 1 |
145544 |
Max J Cookson |
77 |
| 2 |
30428 |
Tate Scharf |
64 |
| 3 |
303148 |
Parker Brookfield |
57 |
| 4 |
307392 |
Chris Carroll3 |
53 |
| 5 |
306496 |
Jay Hicks |
52 |
Most Podiums
| # |
groupid |
Driver |
Podiums |
| 1 |
145544 |
Max J Cookson |
119 |
| 2 |
307392 |
Chris Carroll3 |
91 |
| 3 |
117473 |
Chris Franz |
85 |
| 4 |
30428 |
Tate Scharf |
81 |
| 5 |
303148 |
Parker Brookfield |
76 |
Most Poles
| # |
groupid |
Driver |
Poles |
| 1 |
306496 |
Jay Hicks |
67 |
| 2 |
145544 |
Max J Cookson |
65 |
| 3 |
30428 |
Tate Scharf |
64 |
| 4 |
307392 |
Chris Carroll3 |
51 |
| 5 |
303148 |
Parker Brookfield |
46 |
Best Win Percentage
drivers must have raced 8 or more weeks to feature in this table
| # |
groupid |
Driver |
Win % |
Races |
| 1 |
107777 |
Ryan Kuhn |
88% |
34 |
| 2 |
30428 |
Tate Scharf |
74% |
87 |
| 3 |
303148 |
Parker Brookfield |
69% |
83 |
| 4 |
251202 |
Alex McCollum3 |
66% |
71 |
| 5 |
171664 |
Thomas Axsom |
63% |
38 |
Best Podium Percentage
drivers must have raced 8 or more weeks to feature in this table
| # |
groupid |
Driver |
Podium % |
Races |
| 1 |
107777 |
Ryan Kuhn |
100% |
34 |
| 2 |
307392 |
Chris Carroll3 |
93% |
98 |
| 3 |
30428 |
Tate Scharf |
93% |
87 |
| 4 |
251202 |
Alex McCollum3 |
93% |
71 |
| 5 |
303148 |
Parker Brookfield |
92% |
83 |
Best Pole Percentage
drivers must have raced 8 or more weeks to feature in this table
| # |
groupid |
Driver |
Pole % |
Races |
| 1 |
107777 |
Ryan Kuhn |
88% |
34 |
| 2 |
30428 |
Tate Scharf |
74% |
87 |
| 3 |
220542 |
Lou E Olesky |
69% |
35 |
| 4 |
171664 |
Thomas Axsom |
63% |
38 |
| 5 |
143103 |
Ryan Doucette |
57% |
14 |
Best Average iRating Gains
drivers must have raced 8 or more weeks to feature in this table
| # |
groupid |
Team |
Avg iRating +/- |
Races |
| 1 |
148197 |
Doug Welch |
46 |
19 |
| 2 |
217369 |
Brian Simpson4 |
43 |
25 |
| 3 |
242786 |
Jonathan Davis4 |
40 |
13 |
| 4 |
314388 |
Wally Wilson |
40 |
45 |
| 5 |
112327 |
Tony Strano |
38 |
10 |
Highest Total iRating Gains
| # |
groupid |
Team |
iRating +/- |
Races |
| 1 |
326857 |
Andy Ashley |
2,605 |
165 |
| 2 |
330253 |
Richard D. Thomas |
2,185 |
114 |
| 3 |
310781 |
Andreas Bouchereau |
1,880 |
103 |
| 4 |
178076 |
Alex Shlatz |
1,870 |
98 |
| 5 |
270282 |
Mike Davis2 |
1,806 |
165 |
Cleanest Drivers
drivers must have raced 8 or more weeks to feature in this table
| # |
groupid |
Driver |
Inc / Corner |
| 1 |
261757 |
Matthew Hibbard2 |
0.008 |
| 2 |
307392 |
Chris Carroll3 |
0.009 |
| 3 |
331025 |
Billy Bumgarner |
0.010 |
| 4 |
103723 |
Samuel Reiman |
0.010 |
| 5 |
102519 |
Austin Reinke |
0.010 |