eNASCAR Ignite Series
2018 Season 3
- 480 unique drivers averaging 3.76 starts each.
- 85 drivers raced in 5 or more weeks.
- 123 official races with an average SOF of 2,135.
- 58,895 laps were completed with 9,255 incidents.
Week 1
[Legacy] Charlotte Motor Speedway - 2008
Legends Oval
- Total official races: 32
- Total drivers: 480
- Unique drivers: 324
- Highest SoF: 2,219
- Average SoF: 1,930
| # |
groupid |
Driver |
Points |
| 1 |
90854 |
Jake Matheson |
116 |
| 2 |
218538 |
Andy Trupiano |
115 |
| 3 |
48893 |
Cole V Cabre |
114 |
Week 2
Thompson Speedway Motorsports Park
Oval
- Total official races: 21
- Total drivers: 311
- Unique drivers: 218
- Highest SoF: 2,082
- Average SoF: 1,849
| # |
groupid |
Driver |
Points |
| 1 |
301320 |
Travis Weber |
112 |
| 2 |
225710 |
Daniel R Carter |
110 |
| 3 |
218538 |
Andy Trupiano |
109 |
Week 3
South Boston Speedway
- Total official races: 16
- Total drivers: 244
- Unique drivers: 163
- Highest SoF: 2,155
- Average SoF: 1,983
| # |
groupid |
Driver |
Points |
| 1 |
301320 |
Travis Weber |
117 |
| 2 |
215230 |
Daniel Silvestri |
116 |
| 3 |
145544 |
Max J Cookson |
115 |
Week 4
Atlanta Motor Speedway
Legends Oval
- Total official races: 11
- Total drivers: 158
- Unique drivers: 103
- Highest SoF: 2,490
- Average SoF: 2,291
| # |
groupid |
Driver |
Points |
| 1 |
145544 |
Max J Cookson |
126 |
| 2 |
108148 |
Ryan Matthews |
126 |
| 3 |
173213 |
Garrett Lowe |
124 |
Week 5
Brands Hatch Circuit
Indy
- Total official races: 11
- Total drivers: 159
- Unique drivers: 92
- Highest SoF: 2,857
- Average SoF: 2,596
| # |
groupid |
Driver |
Points |
| 1 |
142748 |
Zac Campbell |
144 |
| 2 |
148179 |
Niclas Laubisch |
143 |
| 3 |
273019 |
Dawson Hess |
141 |
- Total official races: 13
- Total drivers: 182
- Unique drivers: 100
- Highest SoF: 2,561
- Average SoF: 2,327
| # |
groupid |
Driver |
Points |
| 1 |
218538 |
Andy Trupiano |
130 |
| 2 |
237379 |
Dillon Hodge |
128 |
| 3 |
265365 |
Jacob Hall |
127 |
Week 7
Myrtle Beach Speedway
- Total official races: 10
- Total drivers: 151
- Unique drivers: 87
- Highest SoF: 2,679
- Average SoF: 2,432
| # |
groupid |
Driver |
Points |
| 1 |
148179 |
Niclas Laubisch |
139 |
| 2 |
263761 |
Oisín Walsh |
136 |
| 3 |
173213 |
Garrett Lowe |
131 |
- Total official races: 9
- Total drivers: 121
- Unique drivers: 79
- Highest SoF: 2,776
- Average SoF: 2,445
| # |
groupid |
Driver |
Points |
| 1 |
263941 |
Aaron Mulrooney Jr |
143 |
| 2 |
284723 |
Spencer Tart |
141 |
| 3 |
215230 |
Daniel Silvestri |
141 |
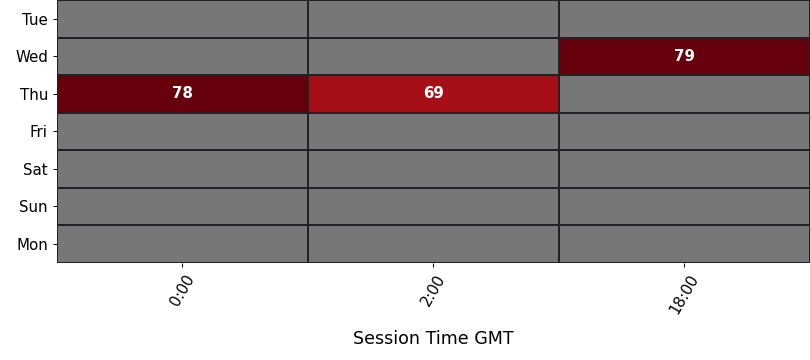
Participation
average number of drivers in each time slot
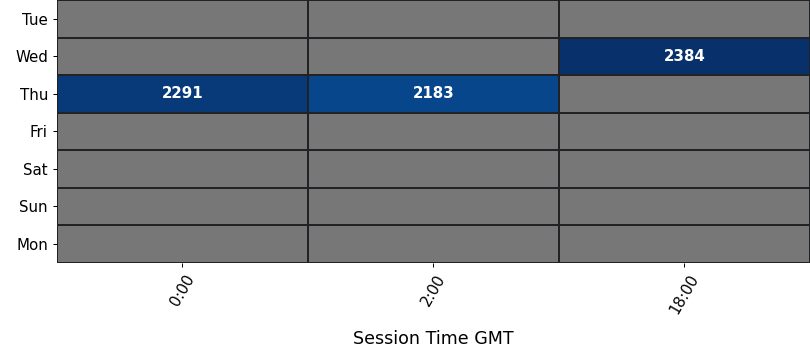
Strength of Field
average SoF of the top split for each time slot
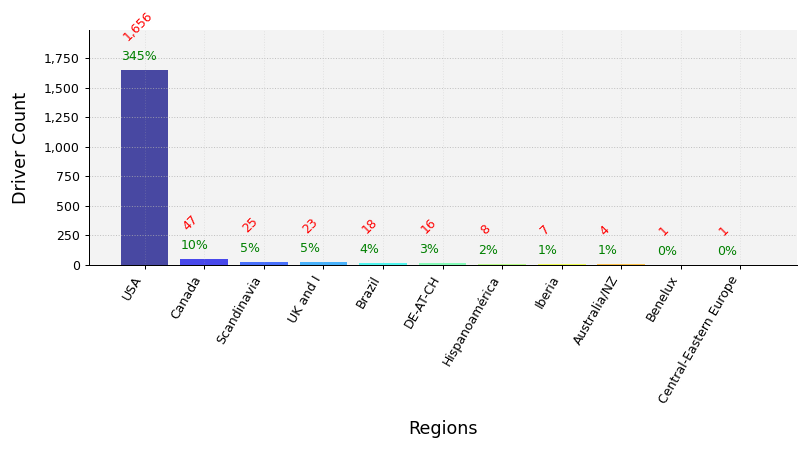
Clubs Distribution
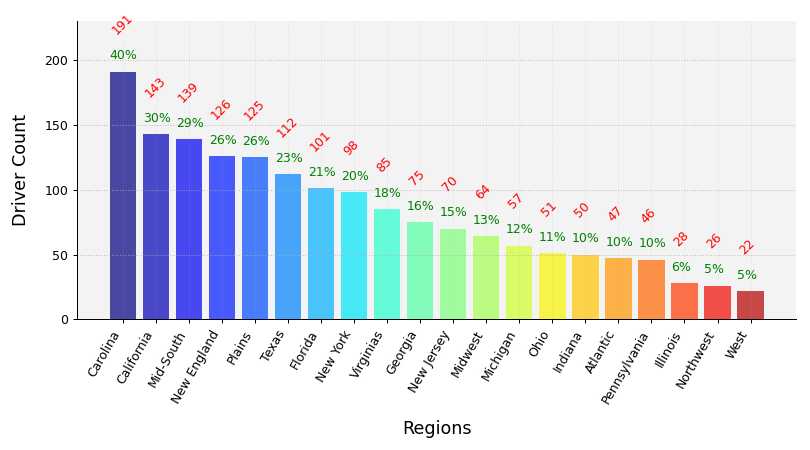
USA Clubs Distribution
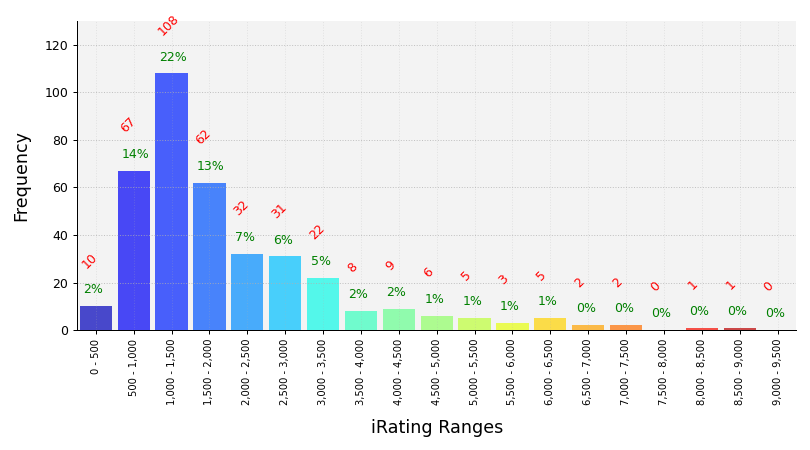
iRating Distribution
Championship Points
| # |
groupid |
Driver |
Points |
| 1 |
173213 |
Garrett Lowe |
643 |
| 2 |
263941 |
Aaron Mulrooney Jr |
633 |
| 3 |
108148 |
Ryan Matthews |
630 |
| 4 |
237379 |
Dillon Hodge |
619 |
| 5 |
218538 |
Andy Trupiano |
609 |
Most Race Starts
| # |
groupid |
Driver |
Starts |
| 1 |
284718 |
Tyler Marble |
24 |
| 2 |
48251 |
Alex Karpowicz |
24 |
| 3 |
306513 |
Camden Weast |
24 |
| 4 |
233847 |
Jason Walat |
22 |
| 5 |
253990 |
Roland Johns |
21 |
Grand Chelems
pole position, won race, fastest lap, led every lap (perfect if 0 inc)
| # |
groupid |
Driver |
Grand Chelems |
Chelem % |
Perfects |
| 1 |
173213 |
Garrett Lowe |
12 |
69% |
11 |
| 2 |
108148 |
Ryan Matthews |
8 |
55% |
6 |
| 3 |
251202 |
Alex McCollum3 |
6 |
50% |
3 |
| 4 |
218538 |
Andy Trupiano |
5 |
12% |
2 |
| 5 |
263941 |
Aaron Mulrooney Jr |
4 |
50% |
4 |
Average Finish Position
drivers must have raced 5 or more weeks to feature in this table
| # |
groupid |
Driver |
Avg Finish Pos |
Races |
| 1 |
173213 |
Garrett Lowe |
1.2 |
16 |
| 2 |
87205 |
Zack Novak |
1.2 |
9 |
| 3 |
108148 |
Ryan Matthews |
1.3 |
11 |
| 4 |
263941 |
Aaron Mulrooney Jr |
1.4 |
8 |
| 5 |
90854 |
Jake Matheson |
2.0 |
13 |
Most Wins
| # |
groupid |
Driver |
Wins |
| 1 |
173213 |
Garrett Lowe |
15 |
| 2 |
108148 |
Ryan Matthews |
10 |
| 3 |
218538 |
Andy Trupiano |
9 |
| 4 |
87205 |
Zack Novak |
8 |
| 5 |
90854 |
Jake Matheson |
7 |
Most Podiums
| # |
groupid |
Driver |
Podiums |
| 1 |
173213 |
Garrett Lowe |
15 |
| 2 |
215230 |
Daniel Silvestri |
12 |
| 3 |
218538 |
Andy Trupiano |
11 |
| 4 |
90854 |
Jake Matheson |
11 |
| 5 |
108148 |
Ryan Matthews |
10 |
Most Poles
| # |
groupid |
Driver |
Poles |
| 1 |
173213 |
Garrett Lowe |
14 |
| 2 |
218538 |
Andy Trupiano |
10 |
| 3 |
108148 |
Ryan Matthews |
9 |
| 4 |
237379 |
Dillon Hodge |
8 |
| 5 |
90854 |
Jake Matheson |
6 |
Best Win Percentage
drivers must have raced 5 or more weeks to feature in this table
| # |
groupid |
Driver |
Win % |
Races |
| 1 |
173213 |
Garrett Lowe |
94% |
16 |
| 2 |
108148 |
Ryan Matthews |
91% |
11 |
| 3 |
87205 |
Zack Novak |
89% |
9 |
| 4 |
263941 |
Aaron Mulrooney Jr |
62% |
8 |
| 5 |
218538 |
Andy Trupiano |
56% |
16 |
Best Podium Percentage
drivers must have raced 5 or more weeks to feature in this table
| # |
groupid |
Driver |
Podium % |
Races |
| 1 |
87205 |
Zack Novak |
100% |
9 |
| 2 |
263941 |
Aaron Mulrooney Jr |
100% |
8 |
| 3 |
173213 |
Garrett Lowe |
94% |
16 |
| 4 |
108148 |
Ryan Matthews |
91% |
11 |
| 5 |
90854 |
Jake Matheson |
85% |
13 |
Best Pole Percentage
drivers must have raced 5 or more weeks to feature in this table
| # |
groupid |
Driver |
Pole % |
Races |
| 1 |
173213 |
Garrett Lowe |
88% |
16 |
| 2 |
108148 |
Ryan Matthews |
82% |
11 |
| 3 |
237379 |
Dillon Hodge |
67% |
12 |
| 4 |
218538 |
Andy Trupiano |
62% |
16 |
| 5 |
263941 |
Aaron Mulrooney Jr |
62% |
8 |
Best Average iRating Gains
drivers must have raced 5 or more weeks to feature in this table
| # |
groupid |
Team |
Avg iRating +/- |
Races |
| 1 |
152440 |
Austin Edwards |
44 |
16 |
| 2 |
197648 |
Kenny Brady |
43 |
12 |
| 3 |
273019 |
Dawson Hess |
42 |
13 |
| 4 |
271947 |
Dylan Ault |
37 |
10 |
| 5 |
307363 |
J. Mitchell Adams |
36 |
17 |
Highest Total iRating Gains
| # |
groupid |
Team |
iRating +/- |
Races |
| 1 |
152440 |
Austin Edwards |
711 |
16 |
| 2 |
307363 |
J. Mitchell Adams |
609 |
17 |
| 3 |
217262 |
Joseph John Braun |
604 |
17 |
| 4 |
273019 |
Dawson Hess |
545 |
13 |
| 5 |
253990 |
Roland Johns |
531 |
21 |
Cleanest Drivers
drivers must have raced 5 or more weeks to feature in this table
| # |
groupid |
Driver |
Inc / Corner |
| 1 |
108148 |
Ryan Matthews |
0.007 |
| 2 |
173213 |
Garrett Lowe |
0.008 |
| 3 |
82704 |
Nicholas Doucette |
0.008 |
| 4 |
263941 |
Aaron Mulrooney Jr |
0.010 |
| 5 |
90854 |
Jake Matheson |
0.010 |