ARCA Menards Series
2019 Season 1
- 7,879 unique drivers averaging 6.10 starts each.
- 283 drivers raced in 8 or more weeks.
- 2,432 official races with an average SOF of 1,735.
- 1,402,961 laps were completed with 244,192 incidents.
Week 1
Darlington Raceway
- Total official races: 123
- Total drivers: 2,147
- Unique drivers: 986
- Highest SoF: 4,232
- Average SoF: 1,999
| # |
groupid |
Driver |
Points |
| 1 |
95316 |
Brandon Trost |
240 |
| 2 |
212706 |
Aaron Smith II |
229 |
| 3 |
112868 |
Taylor Bowe |
218 |
Week 2
New Hampshire Motor Speedway
Oval
- Total official races: 143
- Total drivers: 2,562
- Unique drivers: 1,135
- Highest SoF: 4,242
- Average SoF: 1,907
| # |
groupid |
Driver |
Points |
| 1 |
107777 |
Ryan Kuhn |
226 |
| 2 |
88718 |
Kollin Keister |
215 |
| 3 |
122502 |
Corey Vincent |
212 |
Week 3
[Legacy] Charlotte Motor Speedway - 2008
Oval
- Total official races: 347
- Total drivers: 7,339
- Unique drivers: 2,679
- Highest SoF: 4,376
- Average SoF: 1,723
| # |
groupid |
Driver |
Points |
| 1 |
32765 |
Adam Gilliland |
231 |
| 2 |
202534 |
Jose Solis Jr |
230 |
| 3 |
88718 |
Kollin Keister |
230 |
Week 4
Charlotte Motor Speedway
Roval - 2018
- Total official races: 211
- Total drivers: 4,210
- Unique drivers: 1,851
- Highest SoF: 4,426
- Average SoF: 1,780
| # |
groupid |
Driver |
Points |
| 1 |
186371 |
Matt M Adams |
249 |
| 2 |
61411 |
Emil Bernstorff |
236 |
| 3 |
54515 |
Dylan Roberts |
231 |
Week 5
Martinsville Speedway
- Total official races: 167
- Total drivers: 3,205
- Unique drivers: 1,402
- Highest SoF: 3,796
- Average SoF: 1,706
| # |
groupid |
Driver |
Points |
| 1 |
88718 |
Kollin Keister |
205 |
| 2 |
234124 |
Jake Watson |
192 |
| 3 |
154378 |
Collin Bowden |
191 |
Week 6
[Legacy] Daytona International Speedway - 2008
Oval
- Total official races: 514
- Total drivers: 11,302
- Unique drivers: 3,448
- Highest SoF: 4,489
- Average SoF: 1,593
| # |
groupid |
Driver |
Points |
| 1 |
185448 |
John Theodore |
260 |
| 2 |
160763 |
Eric J. Smith |
250 |
| 3 |
132538 |
Jason Brophy |
248 |
- Total official races: 134
- Total drivers: 2,325
- Unique drivers: 882
- Highest SoF: 3,622
- Average SoF: 1,755
| # |
groupid |
Driver |
Points |
| 1 |
96863 |
Colin Allman |
198 |
| 2 |
234821 |
Kaden Honeycutt |
178 |
| 3 |
128770 |
Timmy L Pacchioli |
177 |
Week 8
New Smyrna Speedway
- Total official races: 163
- Total drivers: 3,066
- Unique drivers: 1,169
- Highest SoF: 3,596
- Average SoF: 1,817
| # |
groupid |
Driver |
Points |
| 1 |
96863 |
Colin Allman |
199 |
| 2 |
234124 |
Jake Watson |
188 |
| 3 |
173787 |
Riley Stenjem |
186 |
Week 9
Iowa Speedway
Oval
- Total official races: 231
- Total drivers: 4,644
- Unique drivers: 1,689
- Highest SoF: 4,107
- Average SoF: 1,764
| # |
groupid |
Driver |
Points |
| 1 |
88718 |
Kollin Keister |
224 |
| 2 |
92069 |
Andrew Schwartz |
212 |
| 3 |
101947 |
Damon Burnette |
209 |
Week 10
Thompson Speedway Motorsports Park
Oval
- Total official races: 183
- Total drivers: 3,500
- Unique drivers: 1,747
- Highest SoF: 3,694
- Average SoF: 1,606
| # |
groupid |
Driver |
Points |
| 1 |
212048 |
Justin Champagne |
180 |
| 2 |
172758 |
Jacob Nottestad |
170 |
| 3 |
101947 |
Damon Burnette |
169 |
Week 11
Canadian Tire Motorsports Park
- Total official races: 101
- Total drivers: 1,775
- Unique drivers: 843
- Highest SoF: 3,675
- Average SoF: 1,925
| # |
groupid |
Driver |
Points |
| 1 |
92069 |
Andrew Schwartz |
187 |
| 2 |
59656 |
Brian Mercurio |
176 |
| 3 |
212706 |
Aaron Smith II |
173 |
Week 12
Stafford Motor Speedway
Full Course
- Total official races: 115
- Total drivers: 1,986
- Unique drivers: 923
- Highest SoF: 3,491
- Average SoF: 1,709
| # |
groupid |
Driver |
Points |
| 1 |
33628 |
Paul Kusheba |
184 |
| 2 |
173787 |
Riley Stenjem |
170 |
| 3 |
120330 |
Parker Retzlaff |
167 |
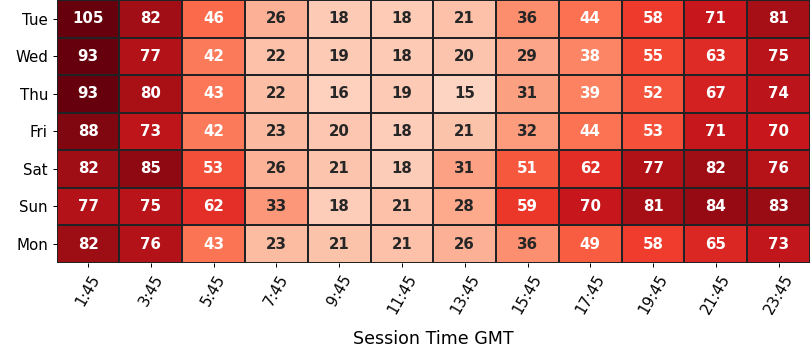
Participation
average number of drivers in each time slot
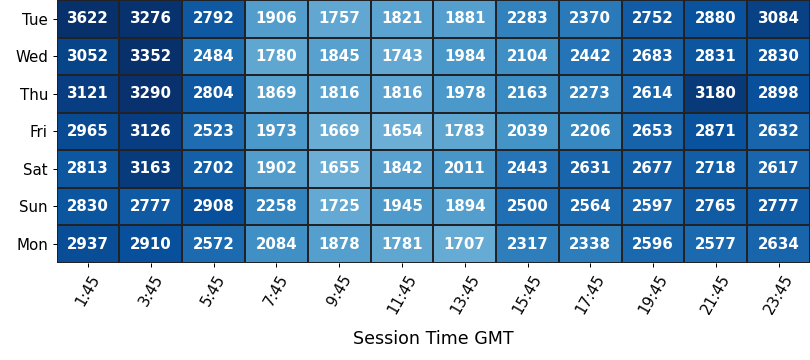
Strength of Field
average SoF of the top split for each time slot
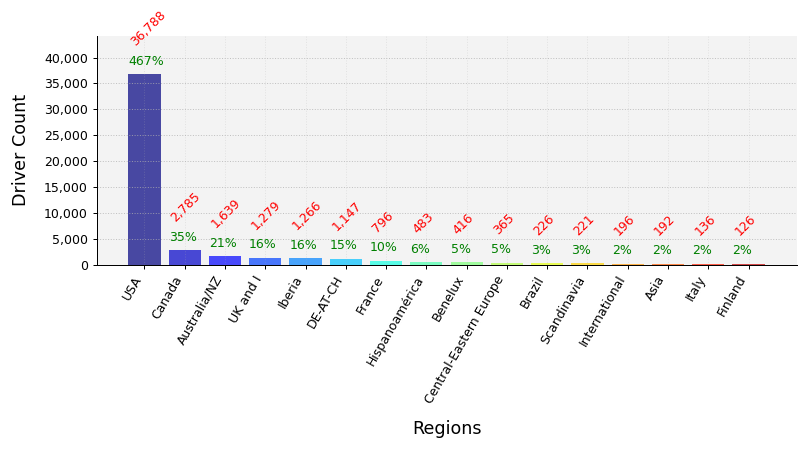
Clubs Distribution
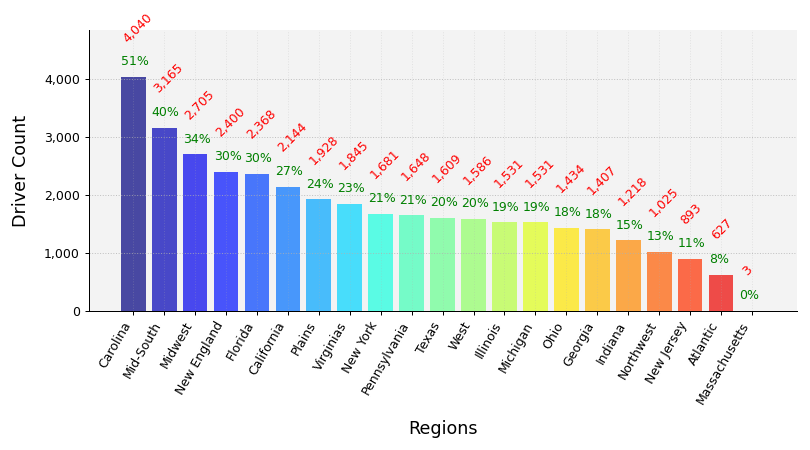
USA Clubs Distribution
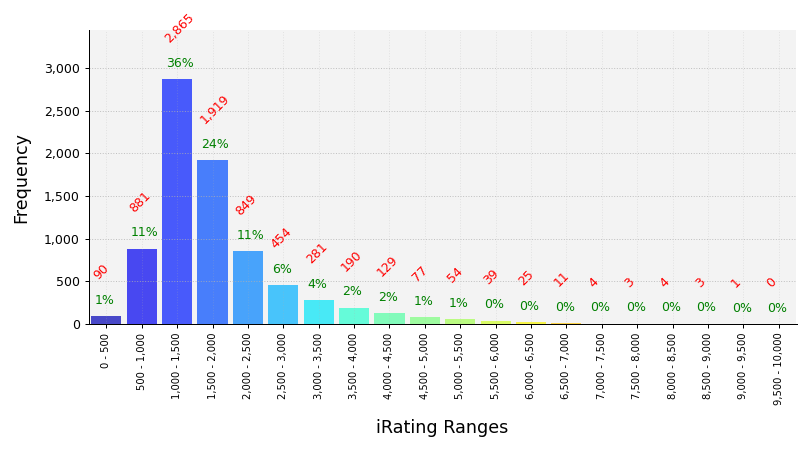
iRating Distribution
Championship Points
| # |
groupid |
Driver |
Points |
| 1 |
92069 |
Andrew Schwartz |
1,431 |
| 2 |
234821 |
Kaden Honeycutt |
1,346 |
| 3 |
91492 |
Don Stephenson |
1,261 |
| 4 |
140820 |
Derek Kraus |
1,232 |
| 5 |
140469 |
Robert Arch |
1,223 |
Most Race Starts
| # |
groupid |
Driver |
Starts |
| 1 |
334451 |
Gareth Anderson |
175 |
| 2 |
347895 |
Jered Lee Siebler |
167 |
| 3 |
213534 |
Joseph Lepore |
140 |
| 4 |
347745 |
Gordon Burris2 |
105 |
| 5 |
228291 |
Gary Thomsen II |
102 |
Grand Chelems
pole position, won race, fastest lap, led every lap (perfect if 0 inc)
| # |
groupid |
Driver |
Grand Chelems |
Chelem % |
Perfects |
| 1 |
119966 |
Derek Justis |
23 |
22% |
16 |
| 2 |
120330 |
Parker Retzlaff |
15 |
26% |
8 |
| 3 |
173787 |
Riley Stenjem |
14 |
33% |
8 |
| 4 |
286074 |
Yuki Furuya |
12 |
43% |
10 |
| 5 |
172758 |
Jacob Nottestad |
11 |
18% |
7 |
Average Finish Position
drivers must have raced 8 or more weeks to feature in this table
| # |
groupid |
Driver |
Avg Finish Pos |
Races |
| 1 |
33381 |
Alex Kan |
3.2 |
8 |
| 2 |
172758 |
Jacob Nottestad |
3.8 |
40 |
| 3 |
91492 |
Don Stephenson |
4.0 |
26 |
| 4 |
36384 |
Jarkko Sihvola |
4.3 |
49 |
| 5 |
17027 |
Harrison Widelitz |
4.8 |
13 |
Most Wins
| # |
groupid |
Driver |
Wins |
| 1 |
119966 |
Derek Justis |
33 |
| 2 |
120330 |
Parker Retzlaff |
22 |
| 3 |
172758 |
Jacob Nottestad |
18 |
| 4 |
173787 |
Riley Stenjem |
17 |
| 5 |
234821 |
Kaden Honeycutt |
17 |
Most Podiums
| # |
groupid |
Driver |
Podiums |
| 1 |
45261 |
Matt Bontempi |
50 |
| 2 |
119966 |
Derek Justis |
49 |
| 3 |
234821 |
Kaden Honeycutt |
33 |
| 4 |
334451 |
Gareth Anderson |
31 |
| 5 |
172758 |
Jacob Nottestad |
30 |
Most Poles
| # |
groupid |
Driver |
Poles |
| 1 |
119966 |
Derek Justis |
37 |
| 2 |
321590 |
Keith Burch |
31 |
| 3 |
54088 |
Rejean Paul |
27 |
| 4 |
45261 |
Matt Bontempi |
24 |
| 5 |
234821 |
Kaden Honeycutt |
20 |
Best Win Percentage
drivers must have raced 8 or more weeks to feature in this table
| # |
groupid |
Driver |
Win % |
Races |
| 1 |
172758 |
Jacob Nottestad |
45% |
40 |
| 2 |
339022 |
Zach Timchak |
38% |
8 |
| 3 |
320315 |
Alexander Heider |
33% |
27 |
| 4 |
234821 |
Kaden Honeycutt |
29% |
58 |
| 5 |
213242 |
David Raber |
26% |
27 |
Best Podium Percentage
drivers must have raced 8 or more weeks to feature in this table
| # |
groupid |
Driver |
Podium % |
Races |
| 1 |
172758 |
Jacob Nottestad |
75% |
40 |
| 2 |
33381 |
Alex Kan |
75% |
8 |
| 3 |
36384 |
Jarkko Sihvola |
59% |
49 |
| 4 |
234821 |
Kaden Honeycutt |
57% |
58 |
| 5 |
213242 |
David Raber |
56% |
27 |
Best Pole Percentage
drivers must have raced 8 or more weeks to feature in this table
| # |
groupid |
Driver |
Pole % |
Races |
| 1 |
172758 |
Jacob Nottestad |
48% |
40 |
| 2 |
139121 |
Memphis Villarreal |
47% |
19 |
| 3 |
33381 |
Alex Kan |
38% |
8 |
| 4 |
234821 |
Kaden Honeycutt |
34% |
58 |
| 5 |
36384 |
Jarkko Sihvola |
29% |
49 |
Best Average iRating Gains
drivers must have raced 8 or more weeks to feature in this table
| # |
groupid |
Team |
Avg iRating +/- |
Races |
| 1 |
288695 |
Jeff D Merck |
42 |
18 |
| 2 |
199729 |
Robert Bollmann |
38 |
8 |
| 3 |
303918 |
Scott Martin14 |
34 |
14 |
| 4 |
56748 |
Javier Sobrino |
29 |
8 |
| 5 |
347530 |
Clint Spillman |
29 |
33 |
Highest Total iRating Gains
| # |
groupid |
Team |
iRating +/- |
Races |
| 1 |
334451 |
Gareth Anderson |
1,993 |
175 |
| 2 |
321590 |
Keith Burch |
1,801 |
88 |
| 3 |
357458 |
Tyler Gunter |
1,604 |
96 |
| 4 |
304843 |
Chad Proctor |
1,570 |
90 |
| 5 |
344169 |
Justin Rocheleau |
1,449 |
71 |
Cleanest Drivers
drivers must have raced 8 or more weeks to feature in this table
| # |
groupid |
Driver |
Inc / Corner |
| 1 |
91492 |
Don Stephenson |
0.007 |
| 2 |
92069 |
Andrew Schwartz |
0.010 |
| 3 |
266653 |
Matt Roseland |
0.011 |
| 4 |
292835 |
Michael Scurlock |
0.012 |
| 5 |
213242 |
David Raber |
0.012 |