Super Late Model Series
2019 Season 1
- 1,198 unique drivers averaging 3.81 starts each.
- 43 drivers raced in 8 or more weeks.
- 393 official races with an average SOF of 2,098.
- 262,384 laps were completed with 22,845 incidents.
Week 1
USA International Speedway
Asphalt
- Total official races: 65
- Total drivers: 878
- Unique drivers: 401
- Highest SoF: 3,765
- Average SoF: 2,167
| # |
groupid |
Driver |
Points |
| 1 |
118122 |
Jimmy Mullis |
196 |
| 2 |
136733 |
Tim Bills |
192 |
| 3 |
96863 |
Colin Allman |
190 |
Week 2
South Boston Speedway
- Total official races: 44
- Total drivers: 512
- Unique drivers: 311
- Highest SoF: 4,849
- Average SoF: 2,170
| # |
groupid |
Driver |
Points |
| 1 |
96863 |
Colin Allman |
251 |
| 2 |
118122 |
Jimmy Mullis |
233 |
| 3 |
251202 |
Alex McCollum3 |
215 |
Week 3
Lanier National Speedway
Asphalt
- Total official races: 58
- Total drivers: 755
- Unique drivers: 354
- Highest SoF: 3,629
- Average SoF: 2,135
| # |
groupid |
Driver |
Points |
| 1 |
151380 |
Joe Schaffer Jr. |
189 |
| 2 |
118122 |
Jimmy Mullis |
181 |
| 3 |
143103 |
Ryan Doucette |
177 |
- Total official races: 27
- Total drivers: 283
- Unique drivers: 165
- Highest SoF: 3,773
- Average SoF: 2,400
| # |
groupid |
Driver |
Points |
| 1 |
211979 |
Kyle Souza |
146 |
| 2 |
178272 |
Michael Goddard |
143 |
| 3 |
316135 |
Christopher Bone |
139 |
Week 5
Bristol Motor Speedway
Dual Pit Roads
- Total official races: 31
- Total drivers: 319
- Unique drivers: 206
- Highest SoF: 2,368
- Average SoF: 1,634
| # |
groupid |
Driver |
Points |
| 1 |
205433 |
Chris Canfield |
131 |
| 2 |
178272 |
Michael Goddard |
123 |
| 3 |
339896 |
Leigh Overton |
116 |
Week 6
Thompson Speedway Motorsports Park
Oval
- Total official races: 31
- Total drivers: 340
- Unique drivers: 192
- Highest SoF: 2,778
- Average SoF: 1,875
| # |
groupid |
Driver |
Points |
| 1 |
134640 |
James Linkiewicz |
121 |
| 2 |
96863 |
Colin Allman |
121 |
| 3 |
178272 |
Michael Goddard |
112 |
Week 7
Five Flags Speedway
- Total official races: 29
- Total drivers: 333
- Unique drivers: 187
- Highest SoF: 3,050
- Average SoF: 2,168
| # |
groupid |
Driver |
Points |
| 1 |
96863 |
Colin Allman |
138 |
| 2 |
174171 |
Rafe Slate |
136 |
| 3 |
231799 |
Jason T Powell |
126 |
Week 8
Lucas Oil Raceway
Oval
- Total official races: 26
- Total drivers: 294
- Unique drivers: 177
- Highest SoF: 4,111
- Average SoF: 2,284
| # |
groupid |
Driver |
Points |
| 1 |
145156 |
Devon Morgan |
180 |
| 2 |
152937 |
Logan Runyon |
155 |
| 3 |
234452 |
Blake Near |
150 |
Week 9
New Smyrna Speedway
- Total official races: 32
- Total drivers: 374
- Unique drivers: 206
- Highest SoF: 3,050
- Average SoF: 1,855
| # |
groupid |
Driver |
Points |
| 1 |
210213 |
Adam Josselyn |
164 |
| 2 |
96863 |
Colin Allman |
154 |
| 3 |
23085 |
Keith Medeiros |
140 |
Week 10
Irwindale Speedway
Outer
- Total official races: 12
- Total drivers: 120
- Unique drivers: 88
- Highest SoF: 3,717
- Average SoF: 2,358
| # |
groupid |
Driver |
Points |
| 1 |
96863 |
Colin Allman |
149 |
| 2 |
108148 |
Ryan Matthews |
147 |
| 3 |
210213 |
Adam Josselyn |
132 |
- Total official races: 15
- Total drivers: 136
- Unique drivers: 99
- Highest SoF: 3,376
- Average SoF: 1,925
| # |
groupid |
Driver |
Points |
| 1 |
210213 |
Adam Josselyn |
152 |
| 2 |
186445 |
Jason M Hughes |
130 |
| 3 |
211979 |
Kyle Souza |
114 |
Week 12
Southern National Motorsports Park
- Total official races: 23
- Total drivers: 216
- Unique drivers: 115
- Highest SoF: 3,769
- Average SoF: 2,265
| # |
groupid |
Driver |
Points |
| 1 |
108148 |
Ryan Matthews |
154 |
| 2 |
178272 |
Michael Goddard |
151 |
| 3 |
82698 |
James Mihlbachler |
142 |
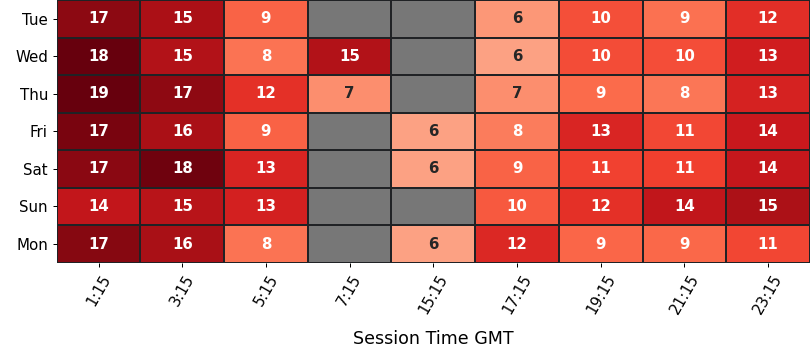
Participation
average number of drivers in each time slot
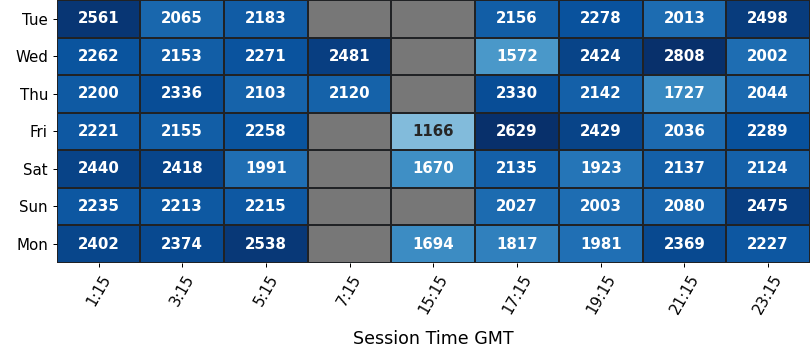
Strength of Field
average SoF of the top split for each time slot
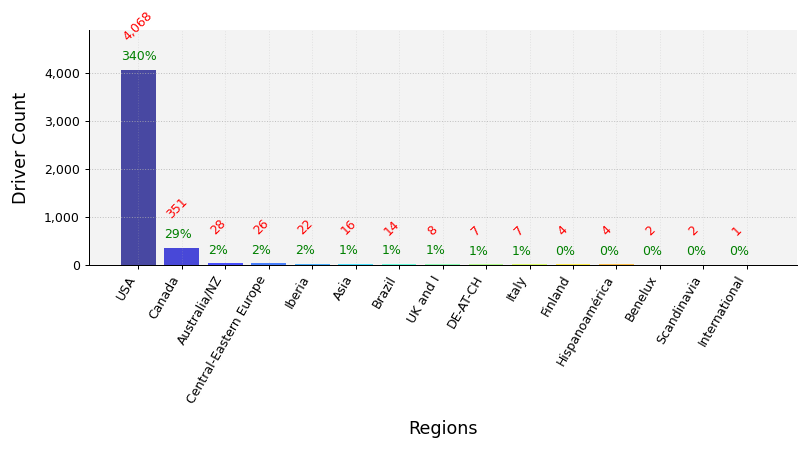
Clubs Distribution
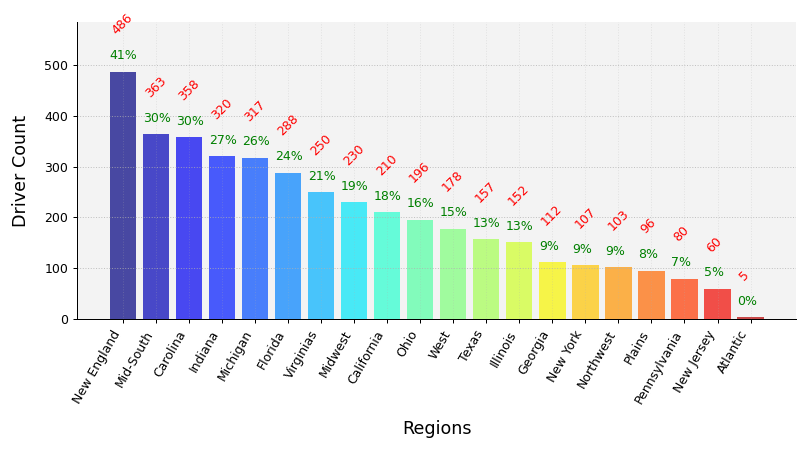
USA Clubs Distribution
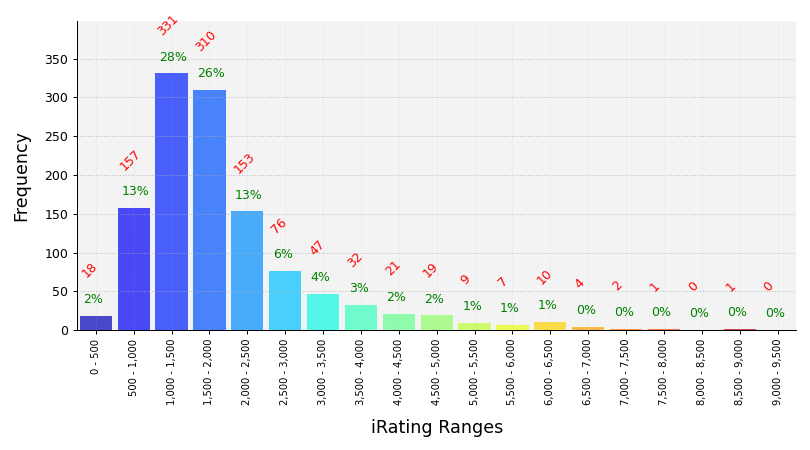
iRating Distribution
Championship Points
| # |
groupid |
Driver |
Points |
| 1 |
96863 |
Colin Allman |
1,310 |
| 2 |
178272 |
Michael Goddard |
1,146 |
| 3 |
210213 |
Adam Josselyn |
1,067 |
| 4 |
211979 |
Kyle Souza |
990 |
| 5 |
205433 |
Chris Canfield |
977 |
Most Race Starts
| # |
groupid |
Driver |
Starts |
| 1 |
352451 |
Austin Thiel |
72 |
| 2 |
75100 |
Petie Madrid |
51 |
| 3 |
332671 |
Eric White2 |
51 |
| 4 |
210213 |
Adam Josselyn |
48 |
| 5 |
288125 |
Anthony Butte |
47 |
Grand Chelems
pole position, won race, fastest lap, led every lap (perfect if 0 inc)
| # |
groupid |
Driver |
Grand Chelems |
Chelem % |
Perfects |
| 1 |
96863 |
Colin Allman |
14 |
68% |
13 |
| 2 |
210213 |
Adam Josselyn |
10 |
19% |
9 |
| 3 |
16627 |
Buddy DAlessandro |
7 |
12% |
5 |
| 4 |
265924 |
Dominic Lee |
7 |
12% |
5 |
| 5 |
178272 |
Michael Goddard |
7 |
7% |
3 |
Average Finish Position
drivers must have raced 8 or more weeks to feature in this table
| # |
groupid |
Driver |
Avg Finish Pos |
Races |
| 1 |
96863 |
Colin Allman |
1.2 |
19 |
| 2 |
210213 |
Adam Josselyn |
2.8 |
48 |
| 3 |
205433 |
Chris Canfield |
2.9 |
45 |
| 4 |
186445 |
Jason M Hughes |
2.9 |
21 |
| 5 |
134640 |
James Linkiewicz |
3.0 |
13 |
Most Wins
| # |
groupid |
Driver |
Wins |
| 1 |
96863 |
Colin Allman |
17 |
| 2 |
210213 |
Adam Josselyn |
17 |
| 3 |
265924 |
Dominic Lee |
16 |
| 4 |
178272 |
Michael Goddard |
15 |
| 5 |
205433 |
Chris Canfield |
13 |
Most Podiums
| # |
groupid |
Driver |
Podiums |
| 1 |
210213 |
Adam Josselyn |
41 |
| 2 |
205433 |
Chris Canfield |
33 |
| 3 |
265924 |
Dominic Lee |
30 |
| 4 |
178272 |
Michael Goddard |
30 |
| 5 |
352451 |
Austin Thiel |
28 |
Most Poles
| # |
groupid |
Driver |
Poles |
| 1 |
265924 |
Dominic Lee |
22 |
| 2 |
210213 |
Adam Josselyn |
20 |
| 3 |
178272 |
Michael Goddard |
18 |
| 4 |
96863 |
Colin Allman |
15 |
| 5 |
186445 |
Jason M Hughes |
13 |
Best Win Percentage
drivers must have raced 8 or more weeks to feature in this table
| # |
groupid |
Driver |
Win % |
Races |
| 1 |
96863 |
Colin Allman |
89% |
19 |
| 2 |
134640 |
James Linkiewicz |
54% |
13 |
| 3 |
186445 |
Jason M Hughes |
38% |
21 |
| 4 |
178272 |
Michael Goddard |
36% |
42 |
| 5 |
210213 |
Adam Josselyn |
35% |
48 |
Best Podium Percentage
drivers must have raced 8 or more weeks to feature in this table
| # |
groupid |
Driver |
Podium % |
Races |
| 1 |
96863 |
Colin Allman |
100% |
19 |
| 2 |
210213 |
Adam Josselyn |
85% |
48 |
| 3 |
186445 |
Jason M Hughes |
81% |
21 |
| 4 |
134640 |
James Linkiewicz |
77% |
13 |
| 5 |
205433 |
Chris Canfield |
73% |
45 |
Best Pole Percentage
drivers must have raced 8 or more weeks to feature in this table
| # |
groupid |
Driver |
Pole % |
Races |
| 1 |
96863 |
Colin Allman |
79% |
19 |
| 2 |
134640 |
James Linkiewicz |
69% |
13 |
| 3 |
186445 |
Jason M Hughes |
62% |
21 |
| 4 |
178272 |
Michael Goddard |
43% |
42 |
| 5 |
210213 |
Adam Josselyn |
42% |
48 |
Best Average iRating Gains
drivers must have raced 8 or more weeks to feature in this table
| # |
groupid |
Team |
Avg iRating +/- |
Races |
| 1 |
275120 |
Christopher Shannon |
41 |
13 |
| 2 |
41229 |
Shawn Grace |
39 |
23 |
| 3 |
96863 |
Colin Allman |
37 |
19 |
| 4 |
178272 |
Michael Goddard |
36 |
42 |
| 5 |
332671 |
Eric White2 |
25 |
51 |
Highest Total iRating Gains
| # |
groupid |
Team |
iRating +/- |
Races |
| 1 |
178272 |
Michael Goddard |
1,493 |
42 |
| 2 |
352451 |
Austin Thiel |
1,400 |
72 |
| 3 |
332671 |
Eric White2 |
1,293 |
51 |
| 4 |
83075 |
Anthony Danta |
1,093 |
28 |
| 5 |
205433 |
Chris Canfield |
984 |
45 |
Cleanest Drivers
drivers must have raced 8 or more weeks to feature in this table
| # |
groupid |
Driver |
Inc / Corner |
| 1 |
186445 |
Jason M Hughes |
0.005 |
| 2 |
96863 |
Colin Allman |
0.006 |
| 3 |
231799 |
Jason T Powell |
0.008 |
| 4 |
210213 |
Adam Josselyn |
0.011 |
| 5 |
134640 |
James Linkiewicz |
0.014 |