Advanced Legends Cup
2019 Season 3
- 9,184 unique drivers averaging 5.08 starts each.
- 245 drivers raced in 8 or more weeks.
- 4,113 official races with an average SOF of 1,163.
- 1,342,439 laps were completed with 196,971 incidents.
Week 1
Charlotte Motor Speedway
Legends Oval - 2018
- Total official races: 242
- Total drivers: 5,703
- Unique drivers: 2,352
- Highest SoF: 3,700
- Average SoF: 1,198
| # |
groupid |
Driver |
Points |
| 1 |
265916 |
Drew Wooten |
168 |
| 2 |
90854 |
Jake Matheson |
164 |
| 3 |
251202 |
Alex McCollum3 |
152 |
Week 2
Oxford Plains Speedway
- Total official races: 274
- Total drivers: 2,987
- Unique drivers: 1,303
- Highest SoF: 4,303
- Average SoF: 1,206
| # |
groupid |
Driver |
Points |
| 1 |
251202 |
Alex McCollum3 |
175 |
| 2 |
145544 |
Max J Cookson |
169 |
| 3 |
171664 |
Thomas Axsom |
163 |
Week 3
USA International Speedway
Asphalt
- Total official races: 404
- Total drivers: 9,890
- Unique drivers: 3,077
- Highest SoF: 3,954
- Average SoF: 1,253
| # |
groupid |
Driver |
Points |
| 1 |
265916 |
Drew Wooten |
200 |
| 2 |
120330 |
Parker Retzlaff |
197 |
| 3 |
251202 |
Alex McCollum3 |
187 |
Week 4
South Boston Speedway
- Total official races: 339
- Total drivers: 7,803
- Unique drivers: 2,794
- Highest SoF: 4,687
- Average SoF: 1,214
| # |
groupid |
Driver |
Points |
| 1 |
120330 |
Parker Retzlaff |
185 |
| 2 |
234918 |
Devin Curl |
181 |
| 3 |
107777 |
Ryan Kuhn |
178 |
Week 5
Thompson Speedway Motorsports Park
Oval
- Total official races: 350
- Total drivers: 8,714
- Unique drivers: 2,940
- Highest SoF: 3,881
- Average SoF: 992
| # |
groupid |
Driver |
Points |
| 1 |
120330 |
Parker Retzlaff |
204 |
| 2 |
306755 |
Michael Crafton |
170 |
| 3 |
96355 |
Jake Griffin |
153 |
Week 6
Lanier National Speedway
Asphalt
- Total official races: 365
- Total drivers: 8,477
- Unique drivers: 2,938
- Highest SoF: 3,501
- Average SoF: 1,234
| # |
groupid |
Driver |
Points |
| 1 |
294209 |
Dylan Bates |
171 |
| 2 |
120330 |
Parker Retzlaff |
162 |
| 3 |
107777 |
Ryan Kuhn |
160 |
Week 7
Charlotte Motor Speedway
Legends Oval - 2018
- Total official races: 285
- Total drivers: 5,703
- Unique drivers: 2,352
- Highest SoF: 4,243
- Average SoF: 1,267
| # |
groupid |
Driver |
Points |
| 1 |
171664 |
Thomas Axsom |
173 |
| 2 |
234821 |
Kaden Honeycutt |
172 |
| 3 |
234452 |
Blake Near |
161 |
- Total official races: 281
- Total drivers: 3,105
- Unique drivers: 1,332
- Highest SoF: 3,385
- Average SoF: 1,142
| # |
groupid |
Driver |
Points |
| 1 |
386356 |
Parker Retzlaff2 |
163 |
| 2 |
234452 |
Blake Near |
163 |
| 3 |
107777 |
Ryan Kuhn |
158 |
Week 9
USA International Speedway
Asphalt
- Total official races: 439
- Total drivers: 9,890
- Unique drivers: 3,077
- Highest SoF: 3,494
- Average SoF: 1,107
| # |
groupid |
Driver |
Points |
| 1 |
107777 |
Ryan Kuhn |
184 |
| 2 |
140469 |
Robert Arch |
169 |
| 3 |
265916 |
Drew Wooten |
152 |
Week 10
South Boston Speedway
- Total official races: 348
- Total drivers: 7,803
- Unique drivers: 2,794
- Highest SoF: 3,744
- Average SoF: 1,163
| # |
groupid |
Driver |
Points |
| 1 |
251202 |
Alex McCollum3 |
156 |
| 2 |
182135 |
Vicki Clark |
150 |
| 3 |
265916 |
Drew Wooten |
148 |
Week 11
Thompson Speedway Motorsports Park
Oval
- Total official races: 401
- Total drivers: 8,714
- Unique drivers: 2,940
- Highest SoF: 2,685
- Average SoF: 1,044
| # |
groupid |
Driver |
Points |
| 1 |
228088 |
Blaze Crawford |
134 |
| 2 |
338108 |
Aaron Plemons |
132 |
| 3 |
320140 |
Riley J Stenjem |
132 |
Week 12
Lanier National Speedway
Asphalt
- Total official races: 377
- Total drivers: 8,477
- Unique drivers: 2,938
- Highest SoF: 3,382
- Average SoF: 1,182
| # |
groupid |
Driver |
Points |
| 1 |
120330 |
Parker Retzlaff |
167 |
| 2 |
218576 |
Robbie Kennealy |
153 |
| 3 |
183903 |
Kaiden Anderson |
152 |
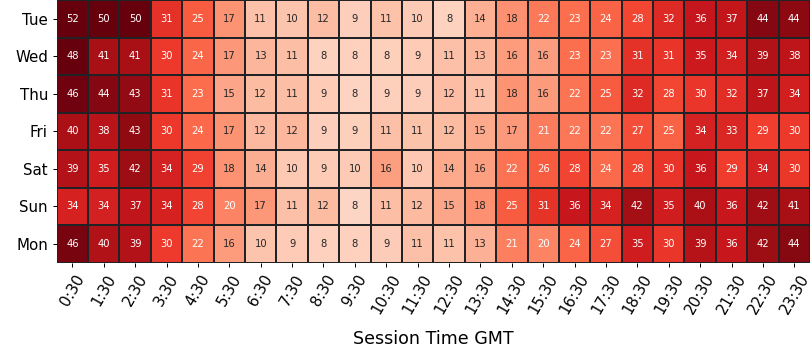
Participation
average number of drivers in each time slot
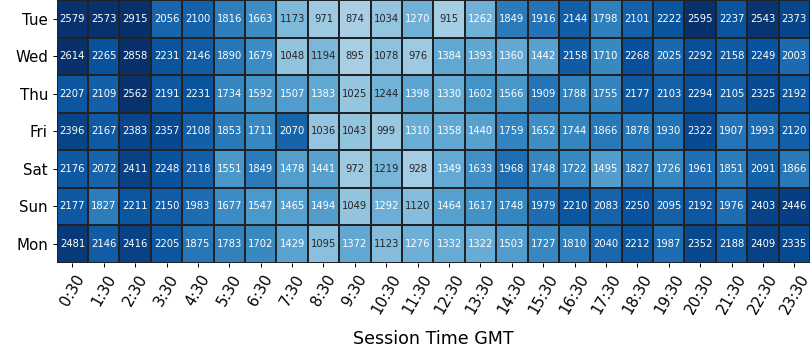
Strength of Field
average SoF of the top split for each time slot
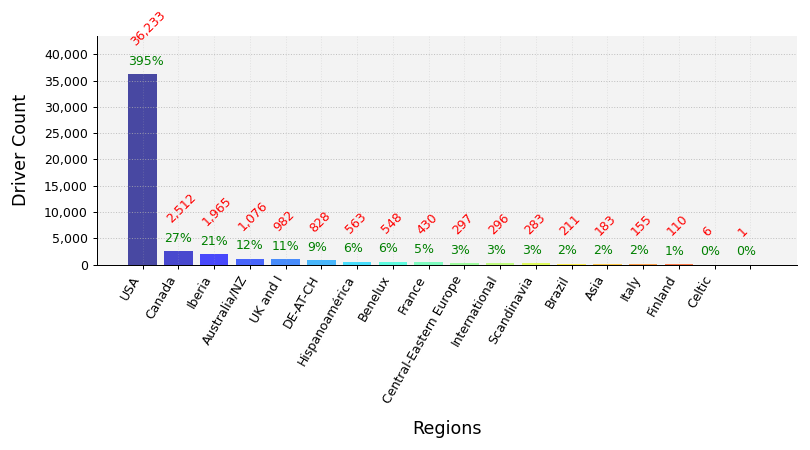
Clubs Distribution
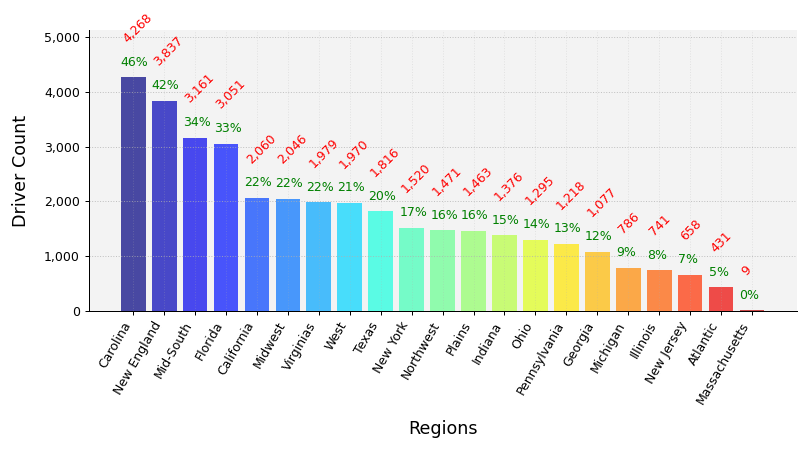
USA Clubs Distribution
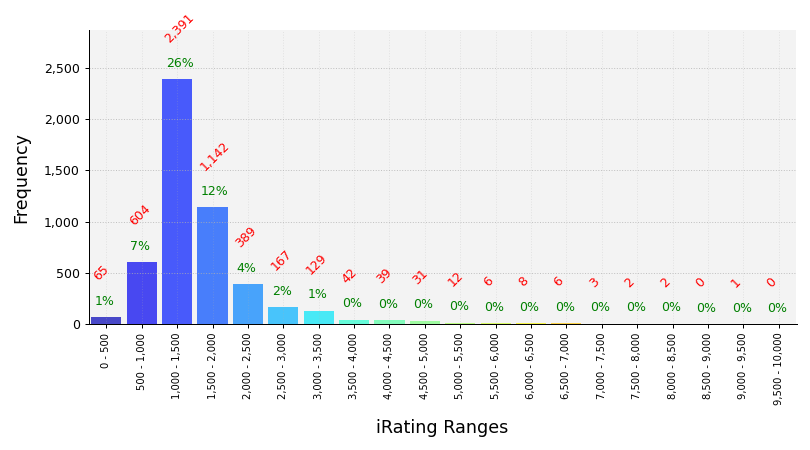
iRating Distribution
Championship Points
| # |
groupid |
Driver |
Points |
| 1 |
107777 |
Ryan Kuhn |
1,249 |
| 2 |
234452 |
Blake Near |
1,182 |
| 3 |
214784 |
Tyler Cox |
1,101 |
| 4 |
357514 |
Kyle Johnson8 |
1,059 |
| 5 |
228088 |
Blaze Crawford |
1,054 |
Most Race Starts
| # |
groupid |
Driver |
Starts |
| 1 |
357514 |
Kyle Johnson8 |
295 |
| 2 |
354465 |
Dylan Baptista |
253 |
| 3 |
346378 |
Kevin Ruff |
250 |
| 4 |
218576 |
Robbie Kennealy |
247 |
| 5 |
375242 |
Michael Bohannon |
246 |
Grand Chelems
pole position, won race, fastest lap, led every lap (perfect if 0 inc)
| # |
groupid |
Driver |
Grand Chelems |
Chelem % |
Perfects |
| 1 |
107777 |
Ryan Kuhn |
65 |
29% |
27 |
| 2 |
218576 |
Robbie Kennealy |
40 |
14% |
35 |
| 3 |
338108 |
Aaron Plemons |
35 |
11% |
24 |
| 4 |
120330 |
Parker Retzlaff |
32 |
39% |
18 |
| 5 |
306725 |
Doug Leasure2 |
31 |
14% |
28 |
Average Finish Position
drivers must have raced 8 or more weeks to feature in this table
| # |
groupid |
Driver |
Avg Finish Pos |
Races |
| 1 |
107777 |
Ryan Kuhn |
1.4 |
93 |
| 2 |
234452 |
Blake Near |
1.5 |
65 |
| 3 |
197648 |
Kenny Brady |
2.4 |
54 |
| 4 |
214784 |
Tyler Cox |
2.4 |
73 |
| 5 |
307392 |
Chris Carroll3 |
2.7 |
21 |
Most Wins
| # |
groupid |
Driver |
Wins |
| 1 |
357514 |
Kyle Johnson8 |
80 |
| 2 |
107777 |
Ryan Kuhn |
80 |
| 3 |
338108 |
Aaron Plemons |
72 |
| 4 |
218576 |
Robbie Kennealy |
62 |
| 5 |
306725 |
Doug Leasure2 |
50 |
Most Podiums
| # |
groupid |
Driver |
Podiums |
| 1 |
357514 |
Kyle Johnson8 |
201 |
| 2 |
338108 |
Aaron Plemons |
154 |
| 3 |
218576 |
Robbie Kennealy |
134 |
| 4 |
306725 |
Doug Leasure2 |
129 |
| 5 |
107777 |
Ryan Kuhn |
87 |
Most Poles
| # |
groupid |
Driver |
Poles |
| 1 |
218576 |
Robbie Kennealy |
81 |
| 2 |
107777 |
Ryan Kuhn |
79 |
| 3 |
338108 |
Aaron Plemons |
68 |
| 4 |
354465 |
Dylan Baptista |
67 |
| 5 |
306725 |
Doug Leasure2 |
59 |
Best Win Percentage
drivers must have raced 8 or more weeks to feature in this table
| # |
groupid |
Driver |
Win % |
Races |
| 1 |
107777 |
Ryan Kuhn |
86% |
93 |
| 2 |
234452 |
Blake Near |
62% |
65 |
| 3 |
214784 |
Tyler Cox |
51% |
73 |
| 4 |
356907 |
Racin Vernon |
49% |
57 |
| 5 |
197648 |
Kenny Brady |
48% |
54 |
Best Podium Percentage
drivers must have raced 8 or more weeks to feature in this table
| # |
groupid |
Driver |
Podium % |
Races |
| 1 |
234452 |
Blake Near |
97% |
65 |
| 2 |
107777 |
Ryan Kuhn |
94% |
93 |
| 3 |
214784 |
Tyler Cox |
86% |
73 |
| 4 |
197648 |
Kenny Brady |
81% |
54 |
| 5 |
307392 |
Chris Carroll3 |
76% |
21 |
Best Pole Percentage
drivers must have raced 8 or more weeks to feature in this table
| # |
groupid |
Driver |
Pole % |
Races |
| 1 |
107777 |
Ryan Kuhn |
85% |
93 |
| 2 |
234452 |
Blake Near |
60% |
65 |
| 3 |
197648 |
Kenny Brady |
54% |
54 |
| 4 |
214784 |
Tyler Cox |
52% |
73 |
| 5 |
291782 |
Giovanni Ruggiero |
51% |
41 |
Best Average iRating Gains
drivers must have raced 8 or more weeks to feature in this table
| # |
groupid |
Team |
Avg iRating +/- |
Races |
| 1 |
322895 |
Richie Morrocco |
52 |
31 |
| 2 |
315170 |
Justin Thooft |
42 |
25 |
| 3 |
382455 |
Brandon Doorlock |
39 |
18 |
| 4 |
299573 |
Brian Freese |
38 |
20 |
| 5 |
346161 |
Adam Johnson9 |
36 |
23 |
Highest Total iRating Gains
| # |
groupid |
Team |
iRating +/- |
Races |
| 1 |
357514 |
Kyle Johnson8 |
3,932 |
295 |
| 2 |
218576 |
Robbie Kennealy |
3,662 |
247 |
| 3 |
338108 |
Aaron Plemons |
3,191 |
227 |
| 4 |
386405 |
Tina West2 |
2,247 |
47 |
| 5 |
384621 |
Dylan Zampa |
2,101 |
113 |
Cleanest Drivers
drivers must have raced 8 or more weeks to feature in this table
| # |
groupid |
Driver |
Inc / Corner |
| 1 |
234452 |
Blake Near |
0.007 |
| 2 |
211979 |
Kyle Souza |
0.007 |
| 3 |
360784 |
Thomas O'Hara |
0.009 |
| 4 |
310930 |
Brian Anderson13 |
0.011 |
| 5 |
309999 |
Ray Radford |
0.012 |