Advanced Legends Cup
2020 Season 3
- 21,736 unique drivers averaging 6.34 starts each.
- 662 drivers raced in 9 or more weeks.
- 10,852 official races with an average SOF of 1,014.
- 4,075,327 laps were completed with 695,368 incidents.
Week 1
Charlotte Motor Speedway
Legends Oval - 2018
- Total official races: 744
- Total drivers: 22,339
- Unique drivers: 8,794
- Highest SoF: 3,710
- Average SoF: 864
| # |
groupid |
Driver |
Points |
| 1 |
320140 |
Riley J Stenjem |
193 |
| 2 |
214784 |
Tyler Cox |
183 |
| 3 |
251202 |
Alex McCollum3 |
176 |
Week 2
Oxford Plains Speedway
- Total official races: 825
- Total drivers: 10,606
- Unique drivers: 4,031
- Highest SoF: 4,071
- Average SoF: 938
| # |
groupid |
Driver |
Points |
| 1 |
218576 |
Robbie Kennealy |
176 |
| 2 |
80659 |
Bart Hector Jr |
175 |
| 3 |
109076 |
Matt Kocher |
173 |
Week 3
USA International Speedway
Asphalt
- Total official races: 1,202
- Total drivers: 27,208
- Unique drivers: 7,330
- Highest SoF: 3,845
- Average SoF: 990
| # |
groupid |
Driver |
Points |
| 1 |
80659 |
Bart Hector Jr |
183 |
| 2 |
338108 |
Aaron Plemons |
181 |
| 3 |
447235 |
John DeVore |
175 |
Week 4
South Boston Speedway
- Total official races: 993
- Total drivers: 23,937
- Unique drivers: 6,904
- Highest SoF: 3,580
- Average SoF: 1,054
| # |
groupid |
Driver |
Points |
| 1 |
479638 |
Matthew Rigatti |
177 |
| 2 |
218576 |
Robbie Kennealy |
169 |
| 3 |
352906 |
Robert Czub |
168 |
Week 5
Thompson Speedway Motorsports Park
Oval
- Total official races: 1,047
- Total drivers: 23,489
- Unique drivers: 6,965
- Highest SoF: 3,951
- Average SoF: 915
| # |
groupid |
Driver |
Points |
| 1 |
438443 |
Trent Newton |
177 |
| 2 |
109076 |
Matt Kocher |
176 |
| 3 |
479638 |
Matthew Rigatti |
169 |
Week 6
Lanier National Speedway
Asphalt
- Total official races: 901
- Total drivers: 20,938
- Unique drivers: 6,402
- Highest SoF: 3,728
- Average SoF: 1,070
| # |
groupid |
Driver |
Points |
| 1 |
85546 |
Parker Traves |
191 |
| 2 |
479638 |
Matthew Rigatti |
184 |
| 3 |
218576 |
Robbie Kennealy |
178 |
Week 7
Charlotte Motor Speedway
Legends Oval - 2018
- Total official races: 511
- Total drivers: 22,339
- Unique drivers: 8,794
- Highest SoF: 3,534
- Average SoF: 973
| # |
groupid |
Driver |
Points |
| 1 |
251202 |
Alex McCollum3 |
178 |
| 2 |
479638 |
Matthew Rigatti |
171 |
| 3 |
352906 |
Robert Czub |
161 |
- Total official races: 742
- Total drivers: 9,336
- Unique drivers: 3,425
- Highest SoF: 3,573
- Average SoF: 1,045
| # |
groupid |
Driver |
Points |
| 1 |
479638 |
Matthew Rigatti |
183 |
| 2 |
60050 |
David Polenz |
178 |
| 3 |
109076 |
Matt Kocher |
165 |
Week 9
USA International Speedway
Asphalt
- Total official races: 888
- Total drivers: 27,208
- Unique drivers: 7,330
- Highest SoF: 3,972
- Average SoF: 1,101
| # |
groupid |
Driver |
Points |
| 1 |
479638 |
Matthew Rigatti |
186 |
| 2 |
109076 |
Matt Kocher |
166 |
| 3 |
47648 |
Brent Matthys |
166 |
Week 10
South Boston Speedway
- Total official races: 876
- Total drivers: 23,937
- Unique drivers: 6,904
- Highest SoF: 4,174
- Average SoF: 1,128
| # |
groupid |
Driver |
Points |
| 1 |
498248 |
Daniel Folds2 |
222 |
| 2 |
386356 |
Parker Retzlaff2 |
195 |
| 3 |
479638 |
Matthew Rigatti |
187 |
Week 11
Thompson Speedway Motorsports Park
Oval
- Total official races: 782
- Total drivers: 23,489
- Unique drivers: 6,965
- Highest SoF: 3,559
- Average SoF: 1,004
| # |
groupid |
Driver |
Points |
| 1 |
479638 |
Matthew Rigatti |
176 |
| 2 |
352906 |
Robert Czub |
170 |
| 3 |
308657 |
Jacob Wright |
164 |
Week 12
Lanier National Speedway
Asphalt
- Total official races: 755
- Total drivers: 20,938
- Unique drivers: 6,402
- Highest SoF: 4,477
- Average SoF: 1,111
| # |
groupid |
Driver |
Points |
| 1 |
479638 |
Matthew Rigatti |
209 |
| 2 |
438443 |
Trent Newton |
181 |
| 3 |
251202 |
Alex McCollum3 |
179 |
Week 13
Charlotte Motor Speedway
Legends Oval - 2018
- Total official races: 558
- Total drivers: 22,339
- Unique drivers: 8,794
- Highest SoF: 3,719
- Average SoF: 971
| # |
groupid |
Driver |
Points |
| 1 |
438443 |
Trent Newton |
167 |
| 2 |
498248 |
Daniel Folds2 |
167 |
| 3 |
369732 |
Timmy Holmes |
157 |
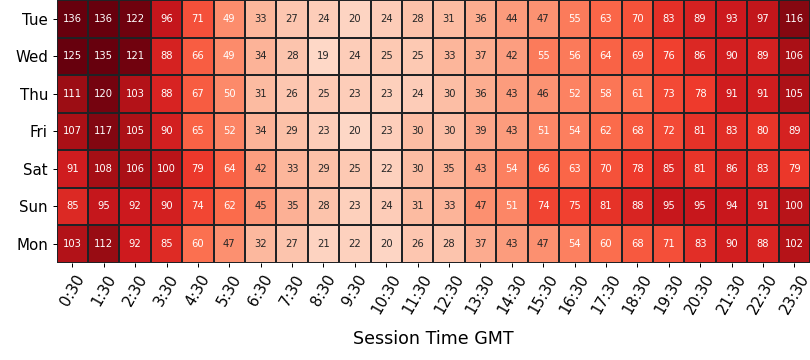
Participation
average number of drivers in each time slot
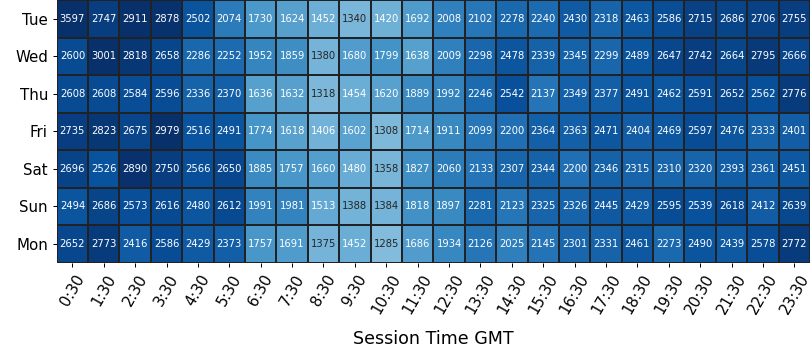
Strength of Field
average SoF of the top split for each time slot
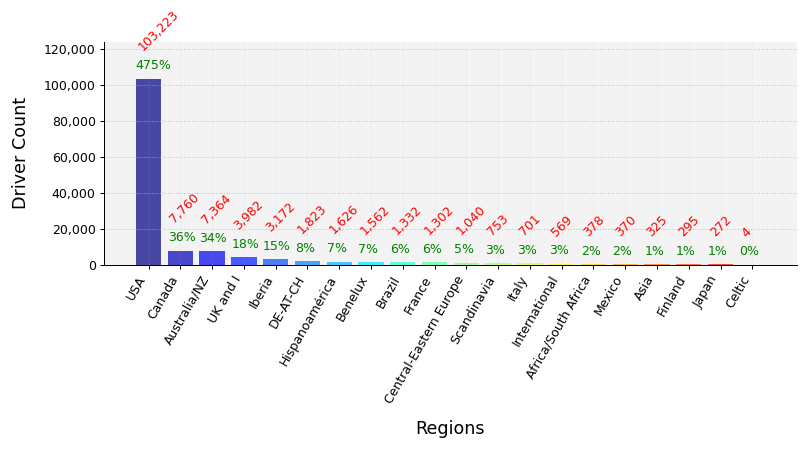
Clubs Distribution
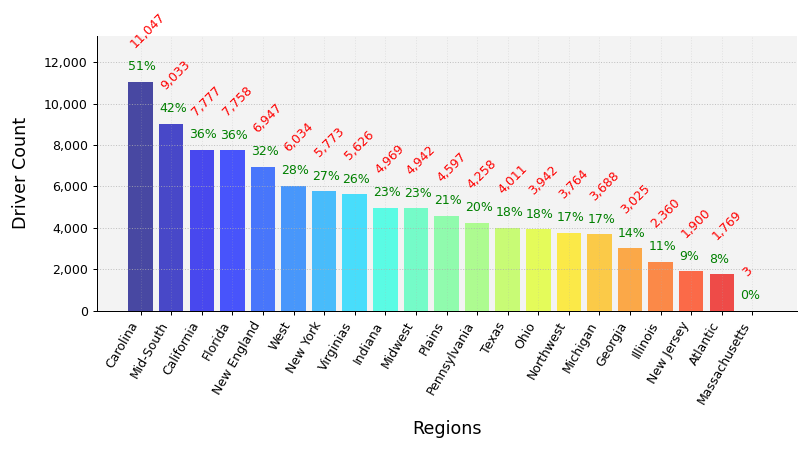
USA Clubs Distribution
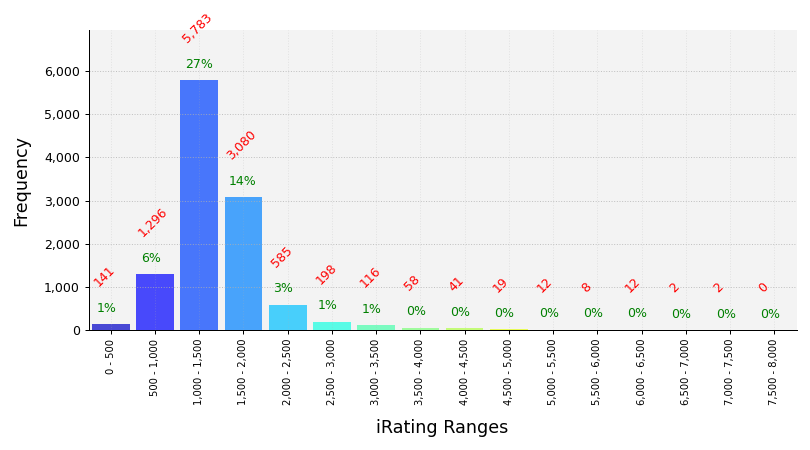
iRating Distribution
Championship Points
| # |
groupid |
Driver |
Points |
| 1 |
479638 |
Matthew Rigatti |
1,642 |
| 2 |
109076 |
Matt Kocher |
1,504 |
| 3 |
352906 |
Robert Czub |
1,477 |
| 4 |
60050 |
David Polenz |
1,454 |
| 5 |
438443 |
Trent Newton |
1,450 |
Most Race Starts
| # |
groupid |
Driver |
Starts |
| 1 |
52234 |
Joe Puccino |
490 |
| 2 |
457309 |
Todd G. |
477 |
| 3 |
109076 |
Matt Kocher |
364 |
| 4 |
436384 |
David Babson |
364 |
| 5 |
308657 |
Jacob Wright |
336 |
Grand Chelems
pole position, won race, fastest lap, led every lap (perfect if 0 inc)
| # |
groupid |
Driver |
Grand Chelems |
Chelem % |
Perfects |
| 1 |
52234 |
Joe Puccino |
98 |
15% |
75 |
| 2 |
109076 |
Matt Kocher |
60 |
12% |
43 |
| 3 |
308657 |
Jacob Wright |
46 |
13% |
44 |
| 4 |
475908 |
Stephen Graham |
34 |
19% |
28 |
| 5 |
457309 |
Todd G. |
29 |
6% |
27 |
Average Finish Position
drivers must have raced 9 or more weeks to feature in this table
| # |
groupid |
Driver |
Avg Finish Pos |
Races |
| 1 |
80659 |
Bart Hector Jr |
1.6 |
32 |
| 2 |
109076 |
Matt Kocher |
1.9 |
364 |
| 3 |
479638 |
Matthew Rigatti |
2.2 |
30 |
| 4 |
354205 |
Cameron Liebal |
2.4 |
123 |
| 5 |
120335 |
Jacob Putman |
2.7 |
159 |
Most Wins
| # |
groupid |
Driver |
Wins |
| 1 |
109076 |
Matt Kocher |
237 |
| 2 |
52234 |
Joe Puccino |
215 |
| 3 |
457309 |
Todd G. |
129 |
| 4 |
308657 |
Jacob Wright |
127 |
| 5 |
354205 |
Cameron Liebal |
75 |
Most Podiums
| # |
groupid |
Driver |
Podiums |
| 1 |
109076 |
Matt Kocher |
334 |
| 2 |
457309 |
Todd G. |
328 |
| 3 |
52234 |
Joe Puccino |
241 |
| 4 |
308657 |
Jacob Wright |
220 |
| 5 |
436384 |
David Babson |
188 |
Most Poles
| # |
groupid |
Driver |
Poles |
| 1 |
52234 |
Joe Puccino |
233 |
| 2 |
457309 |
Todd G. |
227 |
| 3 |
308657 |
Jacob Wright |
142 |
| 4 |
109076 |
Matt Kocher |
116 |
| 5 |
408970 |
Amr Saleh |
90 |
Best Win Percentage
drivers must have raced 9 or more weeks to feature in this table
| # |
groupid |
Driver |
Win % |
Races |
| 1 |
109076 |
Matt Kocher |
65% |
364 |
| 2 |
80659 |
Bart Hector Jr |
62% |
32 |
| 3 |
354205 |
Cameron Liebal |
61% |
123 |
| 4 |
479638 |
Matthew Rigatti |
53% |
30 |
| 5 |
83515 |
Chase Robertson |
50% |
123 |
Best Podium Percentage
drivers must have raced 9 or more weeks to feature in this table
| # |
groupid |
Driver |
Podium % |
Races |
| 1 |
80659 |
Bart Hector Jr |
97% |
32 |
| 2 |
109076 |
Matt Kocher |
92% |
364 |
| 3 |
479638 |
Matthew Rigatti |
87% |
30 |
| 4 |
354205 |
Cameron Liebal |
84% |
123 |
| 5 |
120335 |
Jacob Putman |
80% |
159 |
Best Pole Percentage
drivers must have raced 9 or more weeks to feature in this table
| # |
groupid |
Driver |
Pole % |
Races |
| 1 |
80659 |
Bart Hector Jr |
66% |
32 |
| 2 |
348653 |
Dave Winchel |
60% |
80 |
| 3 |
471273 |
Justin Nix |
58% |
19 |
| 4 |
70868 |
Alfonso Perri |
51% |
55 |
| 5 |
461559 |
Paul Flye2 |
50% |
106 |
Best Average iRating Gains
drivers must have raced 9 or more weeks to feature in this table
| # |
groupid |
Team |
Avg iRating +/- |
Races |
| 1 |
471273 |
Justin Nix |
47 |
19 |
| 2 |
353503 |
Wade Palmer V |
46 |
23 |
| 3 |
468707 |
John DeMatteo |
43 |
57 |
| 4 |
498328 |
Christopher Heitz |
42 |
19 |
| 5 |
98595 |
James Folds |
41 |
44 |
Highest Total iRating Gains
| # |
groupid |
Team |
iRating +/- |
Races |
| 1 |
52234 |
Joe Puccino |
11,866 |
490 |
| 2 |
308657 |
Jacob Wright |
4,738 |
336 |
| 3 |
109076 |
Matt Kocher |
4,621 |
364 |
| 4 |
27286 |
Payton Henry |
4,512 |
146 |
| 5 |
47648 |
Brent Matthys |
3,560 |
197 |
Cleanest Drivers
drivers must have raced 9 or more weeks to feature in this table
| # |
groupid |
Driver |
Inc / Corner |
| 1 |
263568 |
Paul Donnelly2 |
0.000 |
| 2 |
80659 |
Bart Hector Jr |
0.008 |
| 3 |
428543 |
Max Bryant |
0.009 |
| 4 |
505777 |
Brandon Dart |
0.010 |
| 5 |
354205 |
Cameron Liebal |
0.011 |