NASCAR Tour Modified Series
2020 Season 3
- 2,080 unique drivers averaging 3.81 starts each.
- 70 drivers raced in 9 or more weeks.
- 649 official races with an average SOF of 1,804.
- 518,664 laps were completed with 43,101 incidents.
Week 1
South Boston Speedway
- Total official races: 72
- Total drivers: 942
- Unique drivers: 530
- Highest SoF: 3,137
- Average SoF: 1,688
| # |
groupid |
Driver |
Points |
| 1 |
173787 |
Riley Stenjem |
165 |
| 2 |
349258 |
Richard J Murray |
155 |
| 3 |
96850 |
Kyle Odaynik |
144 |
Week 2
North Wilkesboro Speedway
1987
- Total official races: 68
- Total drivers: 859
- Unique drivers: 464
- Highest SoF: 3,225
- Average SoF: 1,703
| # |
groupid |
Driver |
Points |
| 1 |
193418 |
Junior Harville |
177 |
| 2 |
96850 |
Kyle Odaynik |
164 |
| 3 |
82277 |
Andrew McKenzie |
154 |
Week 3
Martinsville Speedway
- Total official races: 51
- Total drivers: 634
- Unique drivers: 380
- Highest SoF: 3,013
- Average SoF: 1,697
| # |
groupid |
Driver |
Points |
| 1 |
173787 |
Riley Stenjem |
162 |
| 2 |
110893 |
Kyle B Scisco |
140 |
| 3 |
256344 |
Ryan A Blanchard |
139 |
Week 4
Lanier National Speedway
Asphalt
- Total official races: 52
- Total drivers: 659
- Unique drivers: 385
- Highest SoF: 2,555
- Average SoF: 1,651
| # |
groupid |
Driver |
Points |
| 1 |
96850 |
Kyle Odaynik |
138 |
| 2 |
211979 |
Kyle Souza |
128 |
| 3 |
258008 |
Leonard Harrison III |
125 |
Week 5
Five Flags Speedway
- Total official races: 37
- Total drivers: 445
- Unique drivers: 257
- Highest SoF: 2,668
- Average SoF: 1,860
| # |
groupid |
Driver |
Points |
| 1 |
110893 |
Kyle B Scisco |
129 |
| 2 |
364390 |
Treyten Lapcevich2 |
128 |
| 3 |
97169 |
Tanner Tallarico |
123 |
Week 6
Irwindale Speedway
Outer
- Total official races: 31
- Total drivers: 320
- Unique drivers: 200
- Highest SoF: 2,531
- Average SoF: 1,805
| # |
groupid |
Driver |
Points |
| 1 |
292068 |
Lucas McNeil |
123 |
| 2 |
462150 |
Andrew Charron |
123 |
| 3 |
97169 |
Tanner Tallarico |
122 |
Week 7
New Hampshire Motor Speedway
Oval
- Total official races: 46
- Total drivers: 591
- Unique drivers: 301
- Highest SoF: 2,793
- Average SoF: 1,893
| # |
groupid |
Driver |
Points |
| 1 |
318941 |
Kenny Zeames |
140 |
| 2 |
16311 |
Thomas Mohl Jr. |
136 |
| 3 |
75290 |
Ryan Lutz |
123 |
- Total official races: 21
- Total drivers: 231
- Unique drivers: 157
- Highest SoF: 2,333
- Average SoF: 1,853
| # |
groupid |
Driver |
Points |
| 1 |
279147 |
Jack Ritchie |
115 |
| 2 |
211979 |
Kyle Souza |
115 |
| 3 |
470908 |
Troy DeCaire |
111 |
Week 9
Iowa Speedway
Oval
- Total official races: 53
- Total drivers: 622
- Unique drivers: 313
- Highest SoF: 2,922
- Average SoF: 1,963
| # |
groupid |
Driver |
Points |
| 1 |
415751 |
Mark Hicks |
158 |
| 2 |
28348 |
Gary Holbrook |
152 |
| 3 |
337534 |
Joseph Segalla |
142 |
Week 10
Stafford Motor Speedway
Full Course
- Total official races: 45
- Total drivers: 509
- Unique drivers: 307
- Highest SoF: 3,686
- Average SoF: 2,023
| # |
groupid |
Driver |
Points |
| 1 |
173787 |
Riley Stenjem |
182 |
| 2 |
109076 |
Matt Kocher |
173 |
| 3 |
251202 |
Alex McCollum3 |
166 |
Week 11
USA International Speedway
Asphalt
- Total official races: 67
- Total drivers: 872
- Unique drivers: 469
- Highest SoF: 2,748
- Average SoF: 1,742
| # |
groupid |
Driver |
Points |
| 1 |
215262 |
Joe Burchett |
151 |
| 2 |
200997 |
James Dupont2 |
141 |
| 3 |
75435 |
Brett Newberry |
136 |
Week 12
Thompson Speedway Motorsports Park
Oval
- Total official races: 59
- Total drivers: 712
- Unique drivers: 384
- Highest SoF: 2,826
- Average SoF: 1,771
| # |
groupid |
Driver |
Points |
| 1 |
96850 |
Kyle Odaynik |
159 |
| 2 |
96863 |
Colin Allman |
143 |
| 3 |
28348 |
Gary Holbrook |
140 |
Week 13
Southern National Motorsports Park
- Total official races: 47
- Total drivers: 527
- Unique drivers: 275
- Highest SoF: 3,472
- Average SoF: 2,005
| # |
groupid |
Driver |
Points |
| 1 |
173787 |
Riley Stenjem |
174 |
| 2 |
246788 |
Tyler Severa |
162 |
| 3 |
23722 |
Daniel Hindre |
153 |
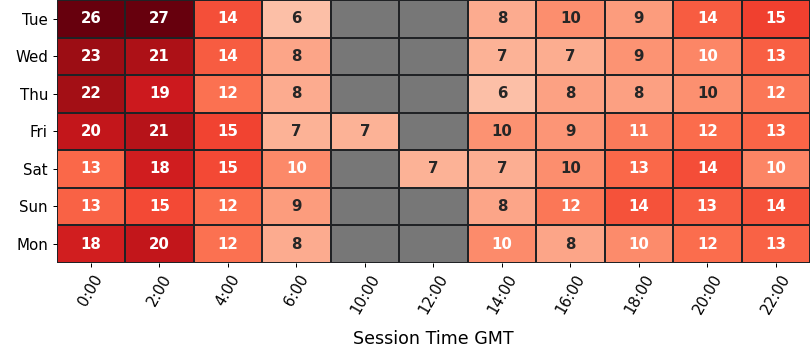
Participation
average number of drivers in each time slot
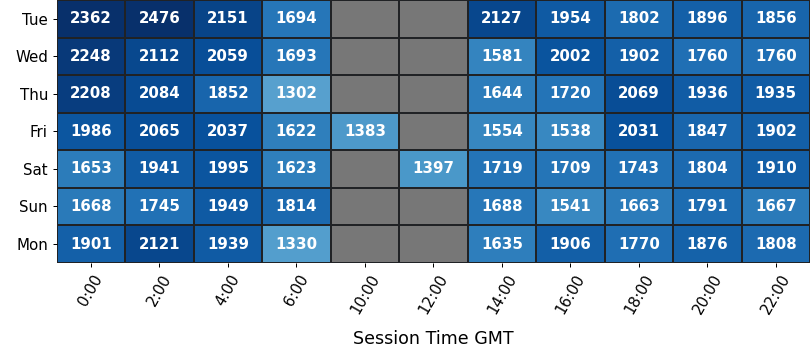
Strength of Field
average SoF of the top split for each time slot
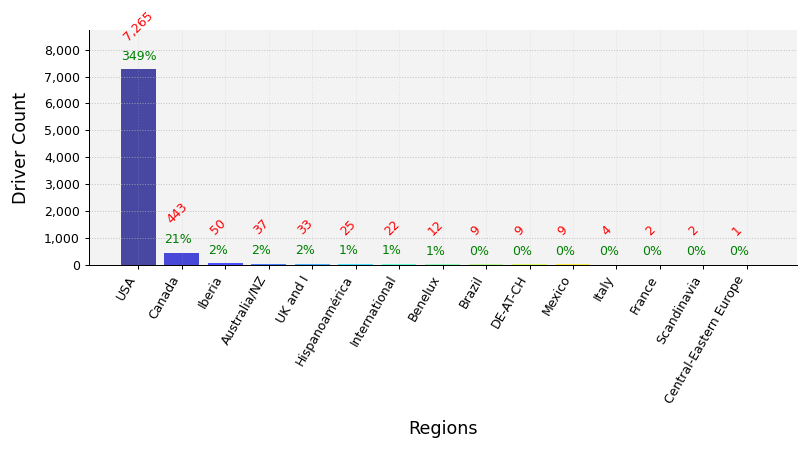
Clubs Distribution
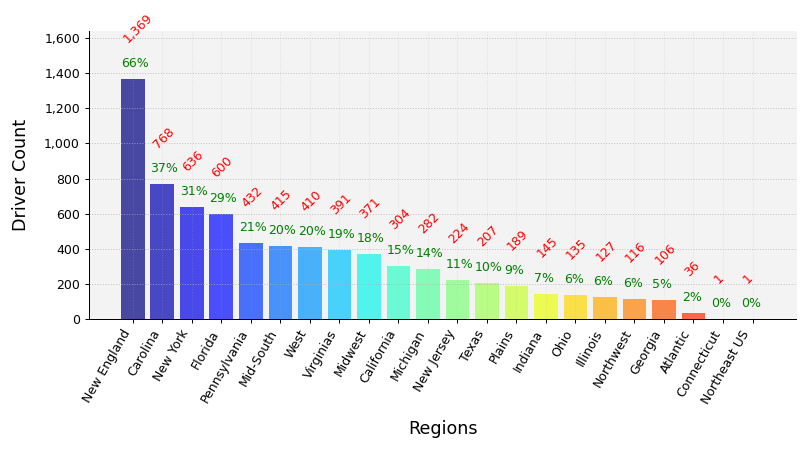
USA Clubs Distribution
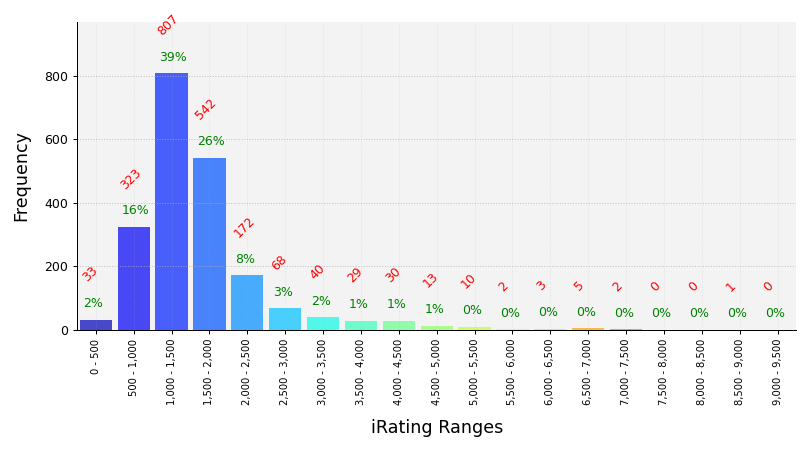
iRating Distribution
Championship Points
| # |
groupid |
Driver |
Points |
| 1 |
201029 |
Jason Perkins2 |
1,180 |
| 2 |
28348 |
Gary Holbrook |
1,163 |
| 3 |
351460 |
Greg Smith9 |
1,027 |
| 4 |
279147 |
Jack Ritchie |
1,014 |
| 5 |
211979 |
Kyle Souza |
1,011 |
Most Race Starts
| # |
groupid |
Driver |
Starts |
| 1 |
15784 |
Nick Leone |
166 |
| 2 |
20812 |
Tommy Flanagan |
122 |
| 3 |
327302 |
Jeffrey Maconi |
98 |
| 4 |
201029 |
Jason Perkins2 |
81 |
| 5 |
474985 |
Chris Ewing |
80 |
Grand Chelems
pole position, won race, fastest lap, led every lap (perfect if 0 inc)
| # |
groupid |
Driver |
Grand Chelems |
Chelem % |
Perfects |
| 1 |
201029 |
Jason Perkins2 |
11 |
11% |
9 |
| 2 |
351460 |
Greg Smith9 |
9 |
25% |
7 |
| 3 |
97169 |
Tanner Tallarico |
8 |
62% |
8 |
| 4 |
52934 |
Brandon Wilkinson |
8 |
15% |
2 |
| 5 |
15784 |
Nick Leone |
7 |
4% |
6 |
Average Finish Position
drivers must have raced 9 or more weeks to feature in this table
| # |
groupid |
Driver |
Avg Finish Pos |
Races |
| 1 |
52934 |
Brandon Wilkinson |
1.8 |
13 |
| 2 |
42609 |
Kyle Ammon |
2.3 |
19 |
| 3 |
337800 |
Derek Trowbridge |
2.4 |
9 |
| 4 |
75435 |
Brett Newberry |
2.5 |
20 |
| 5 |
372075 |
Cory Doty |
2.5 |
11 |
Most Wins
| # |
groupid |
Driver |
Wins |
| 1 |
327302 |
Jeffrey Maconi |
45 |
| 2 |
201029 |
Jason Perkins2 |
29 |
| 3 |
15784 |
Nick Leone |
20 |
| 4 |
229896 |
Dalton Williamson |
19 |
| 5 |
20812 |
Tommy Flanagan |
14 |
Most Podiums
| # |
groupid |
Driver |
Podiums |
| 1 |
327302 |
Jeffrey Maconi |
69 |
| 2 |
20812 |
Tommy Flanagan |
62 |
| 3 |
201029 |
Jason Perkins2 |
61 |
| 4 |
15784 |
Nick Leone |
61 |
| 5 |
229896 |
Dalton Williamson |
28 |
Most Poles
| # |
groupid |
Driver |
Poles |
| 1 |
15784 |
Nick Leone |
23 |
| 2 |
201029 |
Jason Perkins2 |
22 |
| 3 |
351460 |
Greg Smith9 |
18 |
| 4 |
229896 |
Dalton Williamson |
18 |
| 5 |
446591 |
Jonathan Tuckness |
15 |
Best Win Percentage
drivers must have raced 9 or more weeks to feature in this table
| # |
groupid |
Driver |
Win % |
Races |
| 1 |
52934 |
Brandon Wilkinson |
85% |
13 |
| 2 |
211979 |
Kyle Souza |
62% |
16 |
| 3 |
75435 |
Brett Newberry |
55% |
20 |
| 4 |
110893 |
Kyle B Scisco |
50% |
12 |
| 5 |
327302 |
Jeffrey Maconi |
46% |
98 |
Best Podium Percentage
drivers must have raced 9 or more weeks to feature in this table
| # |
groupid |
Driver |
Podium % |
Races |
| 1 |
52934 |
Brandon Wilkinson |
92% |
13 |
| 2 |
42609 |
Kyle Ammon |
89% |
19 |
| 3 |
337800 |
Derek Trowbridge |
89% |
9 |
| 4 |
75435 |
Brett Newberry |
85% |
20 |
| 5 |
372075 |
Cory Doty |
82% |
11 |
Best Pole Percentage
drivers must have raced 9 or more weeks to feature in this table
| # |
groupid |
Driver |
Pole % |
Races |
| 1 |
52934 |
Brandon Wilkinson |
85% |
13 |
| 2 |
337800 |
Derek Trowbridge |
67% |
9 |
| 3 |
351460 |
Greg Smith9 |
64% |
28 |
| 4 |
28348 |
Gary Holbrook |
52% |
25 |
| 5 |
114797 |
Christopher Hiatt |
50% |
10 |
Best Average iRating Gains
drivers must have raced 9 or more weeks to feature in this table
| # |
groupid |
Team |
Avg iRating +/- |
Races |
| 1 |
38225 |
Ken Quartuccio |
41 |
23 |
| 2 |
362328 |
Grant Witcraft |
39 |
10 |
| 3 |
42609 |
Kyle Ammon |
34 |
19 |
| 4 |
279147 |
Jack Ritchie |
31 |
13 |
| 5 |
415694 |
Jonah Espey |
31 |
11 |
Highest Total iRating Gains
| # |
groupid |
Team |
iRating +/- |
Races |
| 1 |
201029 |
Jason Perkins2 |
2,339 |
81 |
| 2 |
200997 |
James Dupont2 |
1,156 |
59 |
| 3 |
496659 |
Mike Swenson2 |
1,068 |
44 |
| 4 |
327302 |
Jeffrey Maconi |
1,066 |
98 |
| 5 |
232214 |
Patrick James3 |
1,038 |
43 |
Cleanest Drivers
drivers must have raced 9 or more weeks to feature in this table
| # |
groupid |
Driver |
Inc / Corner |
| 1 |
75435 |
Brett Newberry |
0.007 |
| 2 |
337800 |
Derek Trowbridge |
0.007 |
| 3 |
28348 |
Gary Holbrook |
0.008 |
| 4 |
351460 |
Greg Smith9 |
0.009 |
| 5 |
19619 |
Eric Witchin |
0.009 |