Advanced Legends Cup
2020 Season 4
- 17,290 unique drivers averaging 6.01 starts each.
- 617 drivers raced in 8 or more weeks.
- 8,344 official races with an average SOF of 1,055.
- 3,204,473 laps were completed with 527,097 incidents.
Week 1
Charlotte Motor Speedway
Legends Oval - 2018
- Total official races: 409
- Total drivers: 9,525
- Unique drivers: 4,029
- Highest SoF: 3,439
- Average SoF: 1,032
| # |
groupid |
Driver |
Points |
| 1 |
271947 |
Dylan Ault |
163 |
| 2 |
211979 |
Kyle Souza |
157 |
| 3 |
438443 |
Trent Newton |
156 |
Week 2
Oxford Plains Speedway
- Total official races: 555
- Total drivers: 6,747
- Unique drivers: 2,624
- Highest SoF: 3,771
- Average SoF: 1,003
| # |
groupid |
Driver |
Points |
| 1 |
109076 |
Matt Kocher |
190 |
| 2 |
369732 |
Timmy Holmes |
170 |
| 3 |
218576 |
Robbie Kennealy |
166 |
Week 3
USA International Speedway
Asphalt
- Total official races: 709
- Total drivers: 20,224
- Unique drivers: 5,907
- Highest SoF: 3,649
- Average SoF: 1,088
| # |
groupid |
Driver |
Points |
| 1 |
109076 |
Matt Kocher |
192 |
| 2 |
218576 |
Robbie Kennealy |
177 |
| 3 |
120642 |
Matt J. Kocher |
174 |
Week 4
South Boston Speedway
- Total official races: 674
- Total drivers: 19,049
- Unique drivers: 5,645
- Highest SoF: 3,797
- Average SoF: 1,069
| # |
groupid |
Driver |
Points |
| 1 |
218576 |
Robbie Kennealy |
188 |
| 2 |
452386 |
Tyler J Payne |
182 |
| 3 |
80659 |
Bart Hector Jr |
181 |
Week 5
Southern National Motorsports Park
- Total official races: 811
- Total drivers: 10,234
- Unique drivers: 3,318
- Highest SoF: 3,301
- Average SoF: 1,044
| # |
groupid |
Driver |
Points |
| 1 |
120335 |
Jacob Putman |
182 |
| 2 |
218576 |
Robbie Kennealy |
175 |
| 3 |
452386 |
Tyler J Payne |
168 |
Week 6
Lanier National Speedway
Asphalt
- Total official races: 780
- Total drivers: 9,852
- Unique drivers: 3,304
- Highest SoF: 3,488
- Average SoF: 1,012
| # |
groupid |
Driver |
Points |
| 1 |
418270 |
Trenton Eurto |
171 |
| 2 |
452386 |
Tyler J Payne |
167 |
| 3 |
543108 |
Adam Hancock3 |
164 |
Week 7
Charlotte Motor Speedway
Legends Oval - 2018
- Total official races: 415
- Total drivers: 9,525
- Unique drivers: 4,029
- Highest SoF: 3,718
- Average SoF: 1,097
| # |
groupid |
Driver |
Points |
| 1 |
452386 |
Tyler J Payne |
182 |
| 2 |
265916 |
Drew Wooten |
171 |
| 3 |
60050 |
David Polenz |
167 |
- Total official races: 662
- Total drivers: 8,161
- Unique drivers: 2,988
- Highest SoF: 3,798
- Average SoF: 1,053
| # |
groupid |
Driver |
Points |
| 1 |
134861 |
Jay Horne |
182 |
| 2 |
369732 |
Timmy Holmes |
173 |
| 3 |
109076 |
Matt Kocher |
164 |
Week 9
USA International Speedway
Asphalt
- Total official races: 886
- Total drivers: 20,224
- Unique drivers: 5,907
- Highest SoF: 3,712
- Average SoF: 1,105
| # |
groupid |
Driver |
Points |
| 1 |
120335 |
Jacob Putman |
181 |
| 2 |
109076 |
Matt Kocher |
178 |
| 3 |
418270 |
Trenton Eurto |
176 |
Week 10
South Boston Speedway
- Total official races: 844
- Total drivers: 19,049
- Unique drivers: 5,645
- Highest SoF: 3,575
- Average SoF: 1,036
| # |
groupid |
Driver |
Points |
| 1 |
452386 |
Tyler J Payne |
180 |
| 2 |
218576 |
Robbie Kennealy |
170 |
| 3 |
80659 |
Bart Hector Jr |
163 |
Week 11
Thompson Speedway Motorsports Park
Oval
- Total official races: 810
- Total drivers: 10,319
- Unique drivers: 3,395
- Highest SoF: 4,014
- Average SoF: 1,042
| # |
groupid |
Driver |
Points |
| 1 |
143103 |
Ryan Doucette |
208 |
| 2 |
214784 |
Tyler Cox |
189 |
| 3 |
98595 |
James Folds |
181 |
- Total official races: 784
- Total drivers: 9,831
- Unique drivers: 3,398
- Highest SoF: 4,874
- Average SoF: 1,071
| # |
groupid |
Driver |
Points |
| 1 |
120335 |
Jacob Putman |
223 |
| 2 |
108148 |
Ryan Matthews |
222 |
| 3 |
58500 |
Jacob Harberts |
204 |
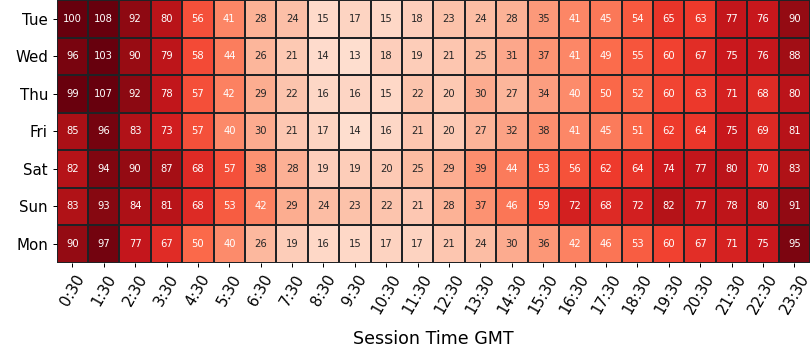
Participation
average number of drivers in each time slot
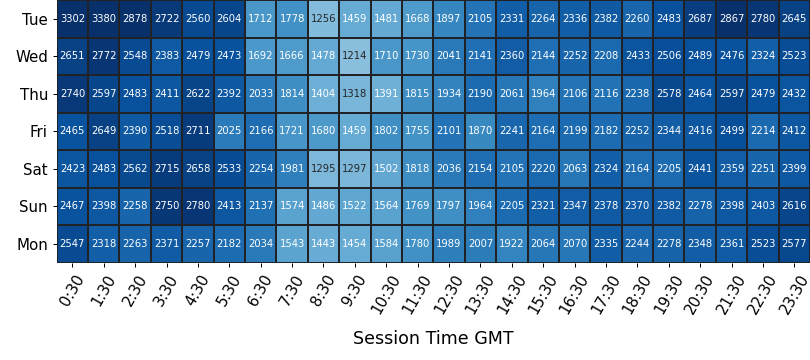
Strength of Field
average SoF of the top split for each time slot
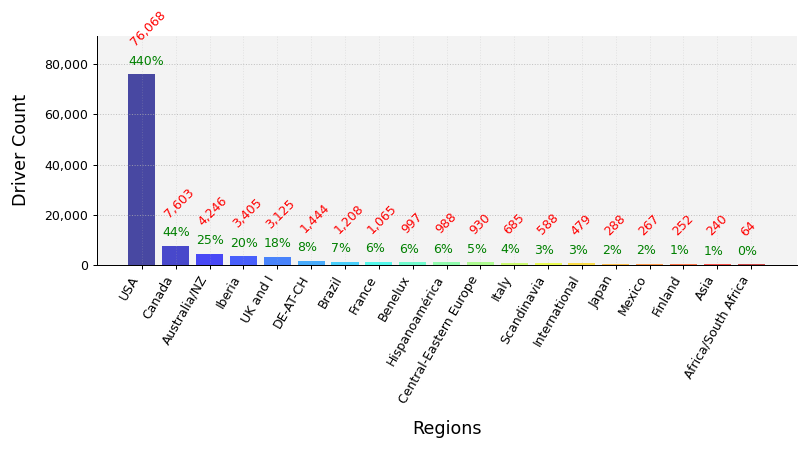
Clubs Distribution
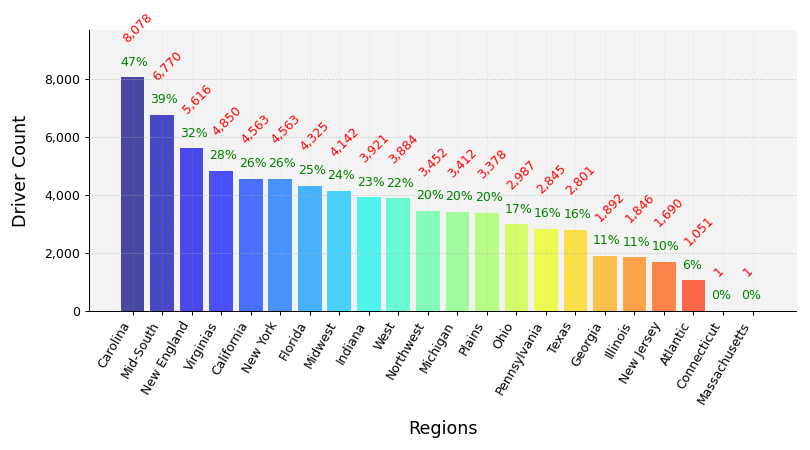
USA Clubs Distribution
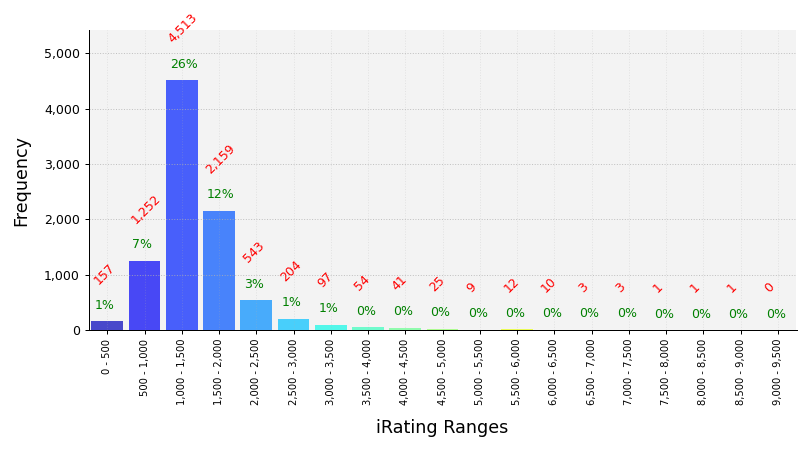
iRating Distribution
Championship Points
| # |
groupid |
Driver |
Points |
| 1 |
109076 |
Matt Kocher |
1,390 |
| 2 |
120335 |
Jacob Putman |
1,388 |
| 3 |
218576 |
Robbie Kennealy |
1,350 |
| 4 |
452386 |
Tyler J Payne |
1,344 |
| 5 |
80659 |
Bart Hector Jr |
1,317 |
Most Race Starts
| # |
groupid |
Driver |
Starts |
| 1 |
556648 |
Tom Scully |
311 |
| 2 |
556507 |
Roger Woomer |
308 |
| 3 |
129508 |
Derekson Pawloski2 |
287 |
| 4 |
462980 |
Mike Mackenzie |
276 |
| 5 |
490036 |
Howard Bentley |
264 |
Grand Chelems
pole position, won race, fastest lap, led every lap (perfect if 0 inc)
| # |
groupid |
Driver |
Grand Chelems |
Chelem % |
Perfects |
| 1 |
452541 |
Chase Belcher |
59 |
26% |
50 |
| 2 |
68767 |
Kevin Fulton |
35 |
12% |
23 |
| 3 |
120335 |
Jacob Putman |
34 |
10% |
17 |
| 4 |
472537 |
EB White |
25 |
5% |
11 |
| 5 |
428238 |
Larry Plummer |
24 |
8% |
12 |
Average Finish Position
drivers must have raced 8 or more weeks to feature in this table
| # |
groupid |
Driver |
Avg Finish Pos |
Races |
| 1 |
354205 |
Cameron Liebal |
1.7 |
78 |
| 2 |
80659 |
Bart Hector Jr |
1.8 |
61 |
| 3 |
369732 |
Timmy Holmes |
1.9 |
23 |
| 4 |
120335 |
Jacob Putman |
2.0 |
165 |
| 5 |
218576 |
Robbie Kennealy |
2.0 |
28 |
Most Wins
| # |
groupid |
Driver |
Wins |
| 1 |
120335 |
Jacob Putman |
101 |
| 2 |
452541 |
Chase Belcher |
97 |
| 3 |
129508 |
Derekson Pawloski2 |
88 |
| 4 |
457309 |
Todd G. |
88 |
| 5 |
68767 |
Kevin Fulton |
80 |
Most Podiums
| # |
groupid |
Driver |
Podiums |
| 1 |
129508 |
Derekson Pawloski2 |
182 |
| 2 |
457309 |
Todd G. |
164 |
| 3 |
452541 |
Chase Belcher |
157 |
| 4 |
120335 |
Jacob Putman |
146 |
| 5 |
462980 |
Mike Mackenzie |
129 |
Most Poles
| # |
groupid |
Driver |
Poles |
| 1 |
457309 |
Todd G. |
133 |
| 2 |
452541 |
Chase Belcher |
116 |
| 3 |
446591 |
Jonathan Tuckness |
97 |
| 4 |
472537 |
EB White |
74 |
| 5 |
68767 |
Kevin Fulton |
73 |
Best Win Percentage
drivers must have raced 8 or more weeks to feature in this table
| # |
groupid |
Driver |
Win % |
Races |
| 1 |
354205 |
Cameron Liebal |
71% |
78 |
| 2 |
109076 |
Matt Kocher |
66% |
62 |
| 3 |
80659 |
Bart Hector Jr |
66% |
61 |
| 4 |
178367 |
Matthew Fritts |
65% |
34 |
| 5 |
120335 |
Jacob Putman |
61% |
165 |
Best Podium Percentage
drivers must have raced 8 or more weeks to feature in this table
| # |
groupid |
Driver |
Podium % |
Races |
| 1 |
369732 |
Timmy Holmes |
96% |
23 |
| 2 |
80659 |
Bart Hector Jr |
93% |
61 |
| 3 |
354205 |
Cameron Liebal |
92% |
78 |
| 4 |
120335 |
Jacob Putman |
88% |
165 |
| 5 |
109076 |
Matt Kocher |
87% |
62 |
Best Pole Percentage
drivers must have raced 8 or more weeks to feature in this table
| # |
groupid |
Driver |
Pole % |
Races |
| 1 |
354205 |
Cameron Liebal |
69% |
78 |
| 2 |
472576 |
Nick Galusha |
69% |
32 |
| 3 |
541957 |
Rick Garvie |
68% |
50 |
| 4 |
80659 |
Bart Hector Jr |
67% |
61 |
| 5 |
178367 |
Matthew Fritts |
65% |
34 |
Best Average iRating Gains
drivers must have raced 8 or more weeks to feature in this table
| # |
groupid |
Team |
Avg iRating +/- |
Races |
| 1 |
178367 |
Matthew Fritts |
64 |
34 |
| 2 |
356836 |
Chad Schnitzler |
54 |
11 |
| 3 |
447514 |
Robert Foster |
48 |
17 |
| 4 |
511193 |
Todd Pudwill |
45 |
26 |
| 5 |
98595 |
James Folds |
44 |
64 |
Highest Total iRating Gains
| # |
groupid |
Team |
iRating +/- |
Races |
| 1 |
68767 |
Kevin Fulton |
7,015 |
184 |
| 2 |
317751 |
Michael Grimmett |
4,303 |
256 |
| 3 |
453000 |
Timothy Keeler |
3,128 |
91 |
| 4 |
548862 |
Joey Lowery |
2,959 |
102 |
| 5 |
404096 |
Jason Overton |
2,894 |
149 |
Cleanest Drivers
drivers must have raced 8 or more weeks to feature in this table
| # |
groupid |
Driver |
Inc / Corner |
| 1 |
263568 |
Paul Donnelly2 |
0.000 |
| 2 |
354205 |
Cameron Liebal |
0.005 |
| 3 |
512358 |
Jonathan Selden-Treiman |
0.008 |
| 4 |
80659 |
Bart Hector Jr |
0.008 |
| 5 |
432294 |
Jonathan Jourden |
0.008 |