ARCA Menards Series
2021 Season 1
- 20,710 unique drivers averaging 7.68 starts each.
- 1,024 drivers raced in 8 or more weeks.
- 7,531 official races with an average SOF of 1,500.
- 5,185,267 laps were completed with 678,868 incidents.
Week 1
Atlanta Motor Speedway
Oval
- Total official races: 615
- Total drivers: 12,861
- Unique drivers: 4,317
- Highest SoF: 4,345
- Average SoF: 1,657
| # |
groupid |
Driver |
Points |
| 1 |
16003 |
Thomas Hazard |
240 |
| 2 |
88718 |
Kollin Keister |
237 |
| 3 |
222922 |
Graham A. Bowlin |
231 |
Week 2
USA International Speedway
Asphalt
- Total official races: 620
- Total drivers: 13,091
- Unique drivers: 5,225
- Highest SoF: 3,889
- Average SoF: 1,504
| # |
groupid |
Driver |
Points |
| 1 |
17243 |
Josh Berry |
211 |
| 2 |
218582 |
Ethan Johnson |
208 |
| 3 |
408201 |
Jordan Brinkley |
198 |
Week 3
Sonoma Raceway
Cup Historic
- Total official races: 245
- Total drivers: 4,313
- Unique drivers: 2,073
- Highest SoF: 2,813
- Average SoF: 1,139
| # |
groupid |
Driver |
Points |
| 1 |
138671 |
Keegan Leahy |
143 |
| 2 |
125400 |
Bobby Zalenski |
137 |
| 3 |
58489 |
Dylan Duval |
134 |
Week 4
Nashville Fairgrounds Speedway
Oval
- Total official races: 462
- Total drivers: 9,317
- Unique drivers: 3,080
- Highest SoF: 3,823
- Average SoF: 1,594
| # |
groupid |
Driver |
Points |
| 1 |
205783 |
Anthony Burroughs |
211 |
| 2 |
240554 |
Justin Yee2 |
206 |
| 3 |
17243 |
Josh Berry |
204 |
Week 5
Southern National Motorsports Park
- Total official races: 546
- Total drivers: 11,236
- Unique drivers: 4,325
- Highest SoF: 3,728
- Average SoF: 1,490
| # |
groupid |
Driver |
Points |
| 1 |
17243 |
Josh Berry |
207 |
| 2 |
288857 |
Magnum Tate |
198 |
| 3 |
368077 |
Casey Tucker2 |
197 |
Week 6
Iowa Speedway
Oval
- Total official races: 548
- Total drivers: 11,220
- Unique drivers: 3,992
- Highest SoF: 3,912
- Average SoF: 1,549
| # |
groupid |
Driver |
Points |
| 1 |
171300 |
Mathew Thunhorst |
221 |
| 2 |
222922 |
Graham A. Bowlin |
211 |
| 3 |
65082 |
Anthony Kernich |
202 |
Week 7
[Legacy] Charlotte Motor Speedway - 2008
Oval
- Total official races: 1,101
- Total drivers: 24,562
- Unique drivers: 7,325
- Highest SoF: 4,417
- Average SoF: 1,495
| # |
groupid |
Driver |
Points |
| 1 |
252932 |
Will Norton |
238 |
| 2 |
18144 |
Brad Wright |
236 |
| 3 |
240554 |
Justin Yee2 |
231 |
Week 8
North Wilkesboro Speedway
1987
- Total official races: 436
- Total drivers: 8,642
- Unique drivers: 3,090
- Highest SoF: 4,063
- Average SoF: 1,542
| # |
groupid |
Driver |
Points |
| 1 |
17243 |
Josh Berry |
202 |
| 2 |
511380 |
Patrick Jones |
193 |
| 3 |
288766 |
Drew Faryniarz |
190 |
Week 9
Daytona International Speedway
Oval
- Total official races: 1,526
- Total drivers: 34,540
- Unique drivers: 8,850
- Highest SoF: 4,096
- Average SoF: 1,408
| # |
groupid |
Driver |
Points |
| 1 |
16286 |
James Krahula |
240 |
| 2 |
415960 |
Matthew Zwack |
233 |
| 3 |
199405 |
Spencer R Owens |
229 |
Week 10
New Smyrna Speedway
- Total official races: 527
- Total drivers: 10,982
- Unique drivers: 3,366
- Highest SoF: 4,289
- Average SoF: 1,506
| # |
groupid |
Driver |
Points |
| 1 |
178083 |
Conor Horn |
229 |
| 2 |
143103 |
Ryan Doucette |
214 |
| 3 |
256965 |
Jarrett Liebert |
211 |
Week 11
Rockingham Speedway
Oval
- Total official races: 466
- Total drivers: 9,519
- Unique drivers: 3,287
- Highest SoF: 3,672
- Average SoF: 1,522
| # |
groupid |
Driver |
Points |
| 1 |
17243 |
Josh Berry |
203 |
| 2 |
119966 |
Derek Justis |
193 |
| 3 |
16884 |
Justin Lowery |
187 |
- Total official races: 439
- Total drivers: 8,771
- Unique drivers: 3,302
- Highest SoF: 4,013
- Average SoF: 1,582
| # |
groupid |
Driver |
Points |
| 1 |
17243 |
Josh Berry |
213 |
| 2 |
38469 |
Daniel E Eberhardt |
204 |
| 3 |
154623 |
Larry Pace |
196 |
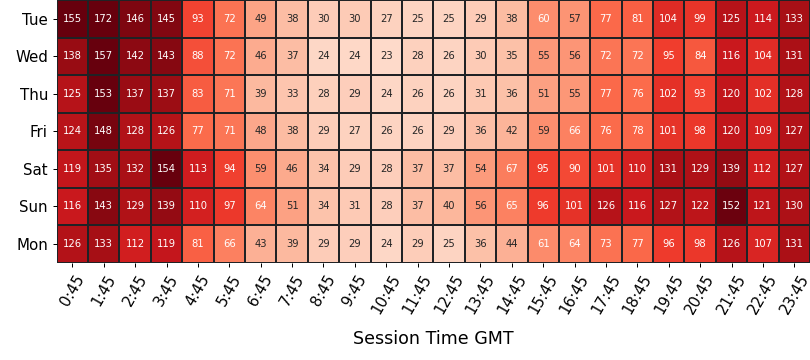
Participation
average number of drivers in each time slot
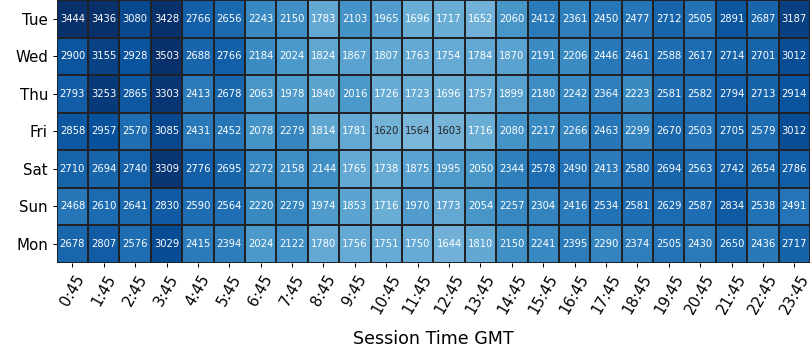
Strength of Field
average SoF of the top split for each time slot
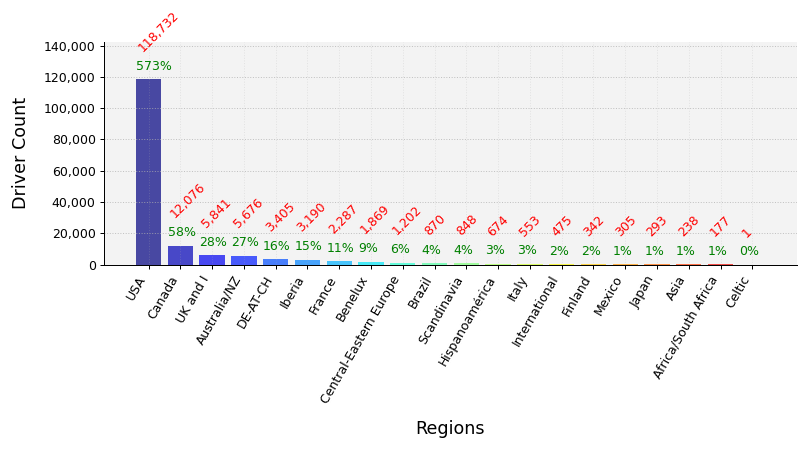
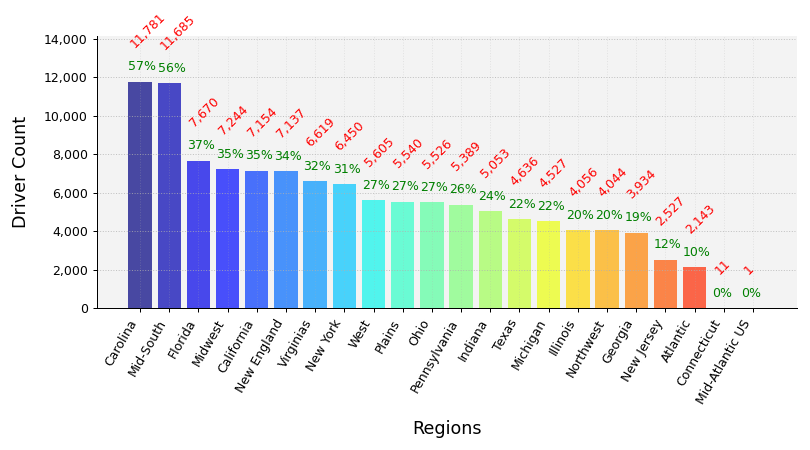
Clubs Distribution
USA Clubs Distribution
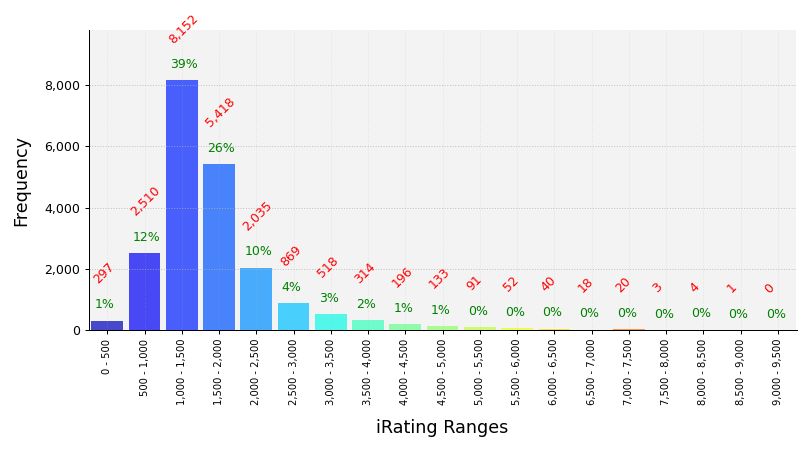
iRating Distribution
Championship Points
| # |
groupid |
Driver |
Points |
| 1 |
17243 |
Josh Berry |
1,707 |
| 2 |
154623 |
Larry Pace |
1,495 |
| 3 |
108141 |
Tim Sozio |
1,467 |
| 4 |
240554 |
Justin Yee2 |
1,419 |
| 5 |
511380 |
Patrick Jones |
1,412 |
Most Race Starts
| # |
groupid |
Driver |
Starts |
| 1 |
63377 |
Trevor Hawkins |
402 |
| 2 |
490083 |
Mark Smith31 |
227 |
| 3 |
410320 |
Joseph Sarkadi |
196 |
| 4 |
577509 |
Casey Carrington3 |
184 |
| 5 |
34729 |
Stevie Minson |
183 |
Grand Chelems
pole position, won race, fastest lap, led every lap (perfect if 0 inc)
| # |
groupid |
Driver |
Grand Chelems |
Chelem % |
Perfects |
| 1 |
288766 |
Drew Faryniarz |
24 |
46% |
22 |
| 2 |
95729 |
Ryan Freitas2 |
15 |
18% |
13 |
| 3 |
64504 |
Joseph Gulotta |
15 |
27% |
12 |
| 4 |
256965 |
Jarrett Liebert |
13 |
53% |
10 |
| 5 |
389366 |
Jaycob Schuffert |
12 |
11% |
8 |
Average Finish Position
drivers must have raced 8 or more weeks to feature in this table
| # |
groupid |
Driver |
Avg Finish Pos |
Races |
| 1 |
154623 |
Larry Pace |
1.7 |
63 |
| 2 |
17243 |
Josh Berry |
2.4 |
42 |
| 3 |
95729 |
Ryan Freitas2 |
2.6 |
73 |
| 4 |
65082 |
Anthony Kernich |
3.0 |
41 |
| 5 |
143255 |
Thomas McGregor |
3.2 |
22 |
Most Wins
| # |
groupid |
Driver |
Wins |
| 1 |
154623 |
Larry Pace |
43 |
| 2 |
288766 |
Drew Faryniarz |
42 |
| 3 |
223523 |
Alec Daffin |
41 |
| 4 |
404096 |
Jason Overton |
38 |
| 5 |
95729 |
Ryan Freitas2 |
32 |
Most Podiums
| # |
groupid |
Driver |
Podiums |
| 1 |
223523 |
Alec Daffin |
74 |
| 2 |
109076 |
Matt Kocher |
65 |
| 3 |
404096 |
Jason Overton |
64 |
| 4 |
63377 |
Trevor Hawkins |
62 |
| 5 |
34729 |
Stevie Minson |
61 |
Most Poles
| # |
groupid |
Driver |
Poles |
| 1 |
404096 |
Jason Overton |
49 |
| 2 |
94517 |
Colton J. Harvey |
42 |
| 3 |
223523 |
Alec Daffin |
40 |
| 4 |
288766 |
Drew Faryniarz |
39 |
| 5 |
64504 |
Joseph Gulotta |
34 |
Best Win Percentage
drivers must have raced 8 or more weeks to feature in this table
| # |
groupid |
Driver |
Win % |
Races |
| 1 |
154623 |
Larry Pace |
68% |
63 |
| 2 |
17243 |
Josh Berry |
52% |
42 |
| 3 |
108141 |
Tim Sozio |
47% |
36 |
| 4 |
119966 |
Derek Justis |
46% |
48 |
| 5 |
95729 |
Ryan Freitas2 |
44% |
73 |
Best Podium Percentage
drivers must have raced 8 or more weeks to feature in this table
| # |
groupid |
Driver |
Podium % |
Races |
| 1 |
154623 |
Larry Pace |
92% |
63 |
| 2 |
17243 |
Josh Berry |
83% |
42 |
| 3 |
54618 |
Kyle Soper |
81% |
16 |
| 4 |
95729 |
Ryan Freitas2 |
78% |
73 |
| 5 |
108141 |
Tim Sozio |
78% |
36 |
Best Pole Percentage
drivers must have raced 8 or more weeks to feature in this table
| # |
groupid |
Driver |
Pole % |
Races |
| 1 |
143255 |
Thomas McGregor |
55% |
22 |
| 2 |
440887 |
Zeke Willis |
48% |
46 |
| 3 |
108141 |
Tim Sozio |
47% |
36 |
| 4 |
154623 |
Larry Pace |
44% |
63 |
| 5 |
95729 |
Ryan Freitas2 |
42% |
73 |
Best Average iRating Gains
drivers must have raced 8 or more weeks to feature in this table
| # |
groupid |
Team |
Avg iRating +/- |
Races |
| 1 |
423634 |
Kelly Michael Puckett |
59 |
22 |
| 2 |
61920 |
Luke Walsh |
54 |
15 |
| 3 |
54618 |
Kyle Soper |
52 |
16 |
| 4 |
537382 |
Travis Wenmoth |
49 |
8 |
| 5 |
513508 |
Martin Rieser2 |
47 |
11 |
Highest Total iRating Gains
| # |
groupid |
Team |
iRating +/- |
Races |
| 1 |
63377 |
Trevor Hawkins |
4,795 |
402 |
| 2 |
595287 |
Noah Bitz |
2,353 |
95 |
| 3 |
366943 |
Charlton Milley |
2,337 |
63 |
| 4 |
250071 |
Robert Johnson19 |
2,129 |
181 |
| 5 |
279069 |
Storm Patterson |
2,065 |
83 |
Cleanest Drivers
drivers must have raced 8 or more weeks to feature in this table
| # |
groupid |
Driver |
Inc / Corner |
| 1 |
60226 |
Lucas Stevenson |
0.001 |
| 2 |
154623 |
Larry Pace |
0.002 |
| 3 |
65082 |
Anthony Kernich |
0.002 |
| 4 |
15583 |
Thomas Lewandowski |
0.002 |
| 5 |
548203 |
Jason Todd |
0.002 |