DIRTcar 305 Sprint Car Fanatec Series
2021 Season 2
- 9,832 unique drivers averaging 7.56 starts each.
- 891 drivers raced in 8 or more weeks.
- 6,223 official races with an average SOF of 1,452.
- 1,718,351 laps were completed with 226,960 incidents.
- Total official races: 556
- Total drivers: 6,734
- Unique drivers: 2,291
- Highest SoF: 4,032
- Average SoF: 1,449
| # |
groupid |
Driver |
Points |
| 1 |
260356 |
Steven Wilson3 |
210 |
| 2 |
55034 |
Michael Meek |
164 |
| 3 |
313758 |
Mark Broderick |
161 |
Week 2
Lanier National Speedway
Dirt
- Total official races: 645
- Total drivers: 14,571
- Unique drivers: 4,678
- Highest SoF: 3,332
- Average SoF: 1,412
| # |
groupid |
Driver |
Points |
| 1 |
266112 |
AJ Renfro |
170 |
| 2 |
446911 |
Zach Jaynes |
164 |
| 3 |
34809 |
Michael Guest |
164 |
Week 3
The Dirt Track at Charlotte
- Total official races: 555
- Total drivers: 6,670
- Unique drivers: 2,460
- Highest SoF: 3,150
- Average SoF: 1,421
| # |
groupid |
Driver |
Points |
| 1 |
409832 |
Seth Perrin |
155 |
| 2 |
94181 |
Austin Hakes |
155 |
| 3 |
221834 |
John Helms |
153 |
Week 4
Bristol Motor Speedway
Dirt
- Total official races: 626
- Total drivers: 7,652
- Unique drivers: 3,137
- Highest SoF: 3,231
- Average SoF: 1,393
| # |
groupid |
Driver |
Points |
| 1 |
358285 |
Tia Moppert |
178 |
| 2 |
114122 |
Ryan Borges |
167 |
| 3 |
365283 |
Jason Randolph |
163 |
Week 5
Limaland Motorsports Park
- Total official races: 564
- Total drivers: 6,755
- Unique drivers: 2,770
- Highest SoF: 3,162
- Average SoF: 1,437
| # |
groupid |
Driver |
Points |
| 1 |
264789 |
Andy Patton |
166 |
| 2 |
184169 |
Kenneth Daeke Jr |
164 |
| 3 |
311154 |
Randy Shreves |
164 |
- Total official races: 576
- Total drivers: 7,010
- Unique drivers: 2,536
- Highest SoF: 3,648
- Average SoF: 1,386
| # |
groupid |
Driver |
Points |
| 1 |
388786 |
Shaun Timmerman2 |
171 |
| 2 |
313517 |
Daniel Hartigan |
162 |
| 3 |
322666 |
Brad Lamberson |
161 |
Week 7
Williams Grove Speedway
- Total official races: 410
- Total drivers: 4,681
- Unique drivers: 1,894
- Highest SoF: 4,057
- Average SoF: 1,579
| # |
groupid |
Driver |
Points |
| 1 |
31545 |
Matt Bussa |
187 |
| 2 |
55034 |
Michael Meek |
187 |
| 3 |
313758 |
Mark Broderick |
180 |
Week 8
Volusia Speedway Park
- Total official races: 489
- Total drivers: 5,824
- Unique drivers: 2,191
- Highest SoF: 3,289
- Average SoF: 1,438
| # |
groupid |
Driver |
Points |
| 1 |
184169 |
Kenneth Daeke Jr |
171 |
| 2 |
301308 |
William Racine |
171 |
| 3 |
110915 |
Nicholas V Howard |
160 |
Week 9
USA International Speedway
Dirt
- Total official races: 544
- Total drivers: 6,560
- Unique drivers: 2,574
- Highest SoF: 3,581
- Average SoF: 1,395
| # |
groupid |
Driver |
Points |
| 1 |
264654 |
Clayton W Tilley |
176 |
| 2 |
379315 |
Tyler J Worley |
171 |
| 3 |
65814 |
Carson Meek |
162 |
Week 10
Cedar Lake Speedway
- Total official races: 389
- Total drivers: 4,332
- Unique drivers: 1,823
- Highest SoF: 3,382
- Average SoF: 1,531
| # |
groupid |
Driver |
Points |
| 1 |
57970 |
Tyler Clem |
169 |
| 2 |
369926 |
Scott King3 |
162 |
| 3 |
509483 |
Jack Ward3 |
160 |
Week 11
Fairbury Speedway
- Total official races: 331
- Total drivers: 3,583
- Unique drivers: 1,493
- Highest SoF: 3,193
- Average SoF: 1,641
| # |
groupid |
Driver |
Points |
| 1 |
370219 |
Ross Korynta |
168 |
| 2 |
420330 |
Dylan Postier |
163 |
| 3 |
352198 |
Aston Hurley |
155 |
Week 12
Lanier National Speedway
Dirt
- Total official races: 544
- Total drivers: 14,571
- Unique drivers: 4,678
- Highest SoF: 3,603
- Average SoF: 1,491
| # |
groupid |
Driver |
Points |
| 1 |
274489 |
Jesse Dakus |
174 |
| 2 |
377984 |
Zachary Davis4 |
165 |
| 3 |
111361 |
Jeffrey West |
163 |
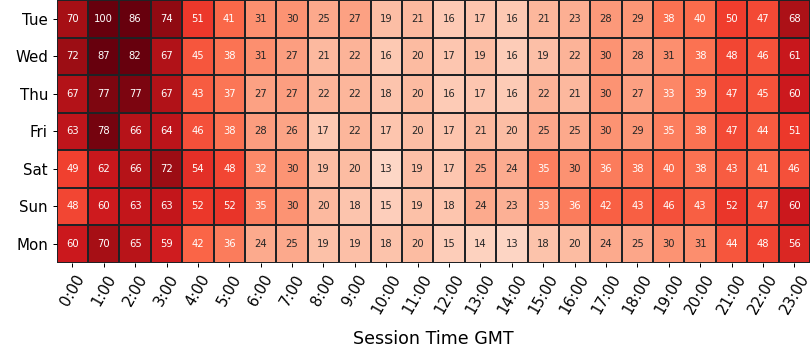
Participation
average number of drivers in each time slot
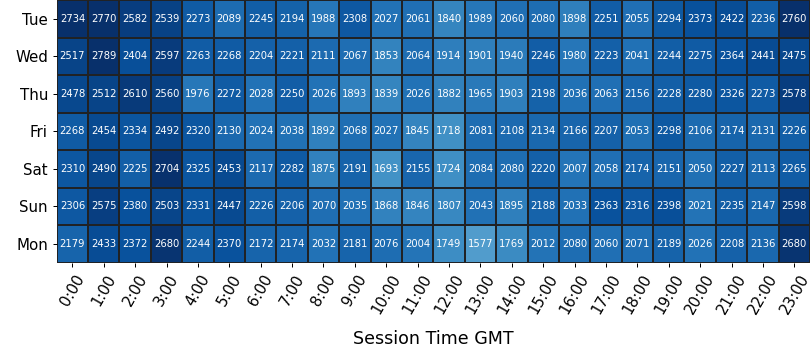
Strength of Field
average SoF of the top split for each time slot
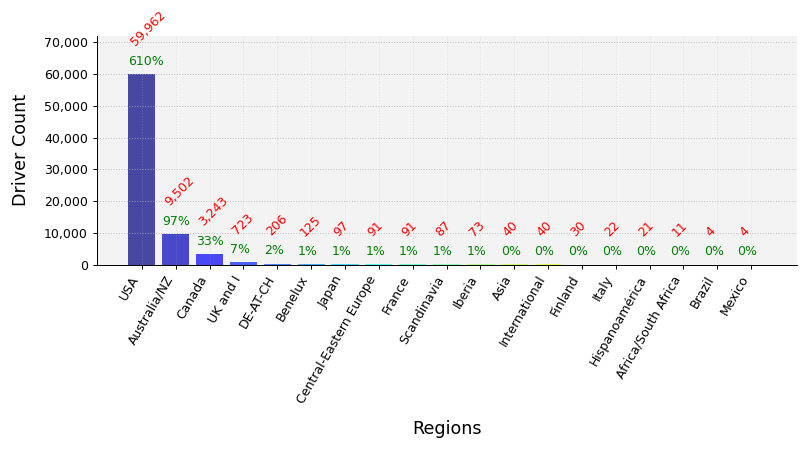
Clubs Distribution
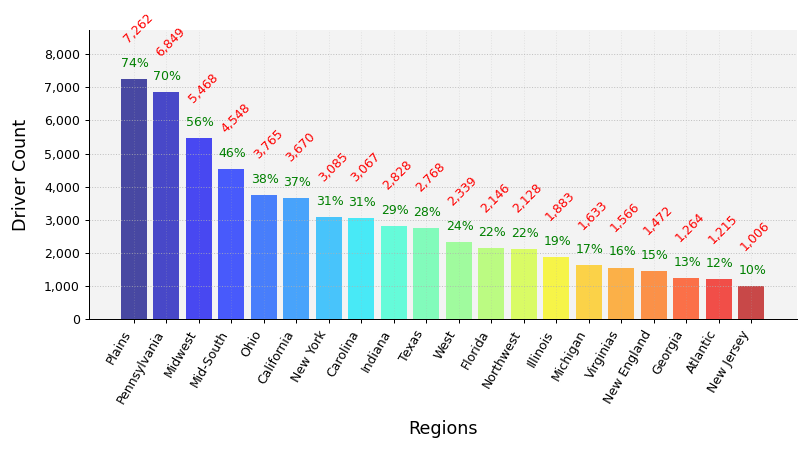
USA Clubs Distribution
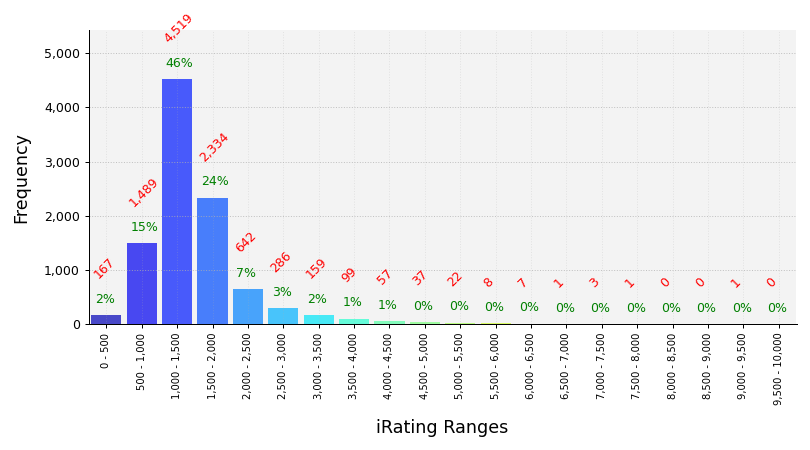
iRating Distribution
Championship Points
| # |
groupid |
Driver |
Points |
| 1 |
184169 |
Kenneth Daeke Jr |
1,229 |
| 2 |
311154 |
Randy Shreves |
1,201 |
| 3 |
71021 |
Cory Wentzel |
1,188 |
| 4 |
365283 |
Jason Randolph |
1,175 |
| 5 |
301308 |
William Racine |
1,157 |
Most Race Starts
| # |
groupid |
Driver |
Starts |
| 1 |
475908 |
Stephen Graham |
277 |
| 2 |
352901 |
Dianna Mithen2 |
198 |
| 3 |
557224 |
David Richards6 |
191 |
| 4 |
615279 |
Kurtis Klinger |
184 |
| 5 |
497228 |
Robert Beach3 |
168 |
Grand Chelems
pole position, won race, fastest lap, led every lap (perfect if 0 inc)
| # |
groupid |
Driver |
Grand Chelems |
Chelem % |
Perfects |
| 1 |
475908 |
Stephen Graham |
39 |
11% |
30 |
| 2 |
388786 |
Shaun Timmerman2 |
33 |
69% |
27 |
| 3 |
55034 |
Michael Meek |
31 |
42% |
28 |
| 4 |
460842 |
Vincent St-louis |
25 |
11% |
14 |
| 5 |
79074 |
Joel Blewitt |
20 |
57% |
17 |
Average Finish Position
drivers must have raced 8 or more weeks to feature in this table
| # |
groupid |
Driver |
Avg Finish Pos |
Races |
| 1 |
287808 |
Jake Greenwood |
1.4 |
43 |
| 2 |
260356 |
Steven Wilson3 |
1.6 |
8 |
| 3 |
279314 |
Mike Lefholz |
1.9 |
8 |
| 4 |
365283 |
Jason Randolph |
2.0 |
22 |
| 5 |
31545 |
Matt Bussa |
2.0 |
29 |
Most Wins
| # |
groupid |
Driver |
Wins |
| 1 |
475908 |
Stephen Graham |
74 |
| 2 |
55034 |
Michael Meek |
53 |
| 3 |
460842 |
Vincent St-louis |
40 |
| 4 |
388786 |
Shaun Timmerman2 |
38 |
| 5 |
71021 |
Cory Wentzel |
36 |
Most Podiums
| # |
groupid |
Driver |
Podiums |
| 1 |
475908 |
Stephen Graham |
152 |
| 2 |
557224 |
David Richards6 |
92 |
| 3 |
460842 |
Vincent St-louis |
85 |
| 4 |
71021 |
Cory Wentzel |
76 |
| 5 |
364841 |
Cody Terry2 |
67 |
Most Poles
| # |
groupid |
Driver |
Poles |
| 1 |
475908 |
Stephen Graham |
78 |
| 2 |
55034 |
Michael Meek |
43 |
| 3 |
460842 |
Vincent St-louis |
41 |
| 4 |
388786 |
Shaun Timmerman2 |
34 |
| 5 |
71021 |
Cory Wentzel |
34 |
Best Win Percentage
drivers must have raced 8 or more weeks to feature in this table
| # |
groupid |
Driver |
Win % |
Races |
| 1 |
287808 |
Jake Greenwood |
81% |
43 |
| 2 |
31545 |
Matt Bussa |
72% |
29 |
| 3 |
258812 |
Gerry Torres |
71% |
14 |
| 4 |
133486 |
Manuela Balloni |
67% |
9 |
| 5 |
260356 |
Steven Wilson3 |
62% |
8 |
Best Podium Percentage
drivers must have raced 8 or more weeks to feature in this table
| # |
groupid |
Driver |
Podium % |
Races |
| 1 |
287808 |
Jake Greenwood |
95% |
43 |
| 2 |
365283 |
Jason Randolph |
91% |
22 |
| 3 |
31545 |
Matt Bussa |
90% |
29 |
| 4 |
370219 |
Ross Korynta |
89% |
18 |
| 5 |
355784 |
Daniel Zegers |
89% |
9 |
Best Pole Percentage
drivers must have raced 8 or more weeks to feature in this table
| # |
groupid |
Driver |
Pole % |
Races |
| 1 |
133486 |
Manuela Balloni |
78% |
9 |
| 2 |
258812 |
Gerry Torres |
71% |
14 |
| 3 |
446911 |
Zach Jaynes |
70% |
47 |
| 4 |
355784 |
Daniel Zegers |
67% |
9 |
| 5 |
420330 |
Dylan Postier |
63% |
27 |
Best Average iRating Gains
drivers must have raced 8 or more weeks to feature in this table
| # |
groupid |
Team |
Avg iRating +/- |
Races |
| 1 |
133486 |
Manuela Balloni |
80 |
9 |
| 2 |
462692 |
JON stapleton4 |
61 |
13 |
| 3 |
258812 |
Gerry Torres |
47 |
14 |
| 4 |
353382 |
Thomas Noftz |
45 |
8 |
| 5 |
185431 |
Jonathan Dalrymple |
44 |
13 |
Highest Total iRating Gains
| # |
groupid |
Team |
iRating +/- |
Races |
| 1 |
615687 |
Zach Dykstra |
2,255 |
106 |
| 2 |
590179 |
Cameron Prichard |
1,919 |
90 |
| 3 |
475908 |
Stephen Graham |
1,903 |
277 |
| 4 |
268236 |
Jeff Flaro |
1,810 |
94 |
| 5 |
512681 |
Davy Davis |
1,796 |
115 |
Cleanest Drivers
drivers must have raced 8 or more weeks to feature in this table
| # |
groupid |
Driver |
Inc / Corner |
| 1 |
72758 |
Ramo Stot |
0.005 |
| 2 |
424661 |
Brian Behm |
0.005 |
| 3 |
287808 |
Jake Greenwood |
0.008 |
| 4 |
360903 |
Scott Carpenter7 |
0.008 |
| 5 |
463655 |
brad Jones5 |
0.008 |