Dirt Legends Cup
2021 Season 2
- 2,262 unique drivers averaging 2.35 starts each.
- 27 drivers raced in 8 or more weeks.
- 658 official races with an average SOF of 1,597.
- 116,026 laps were completed with 12,972 incidents.
Week 1
Lanier National Speedway
Dirt
- Total official races: 155
- Total drivers: 1,873
- Unique drivers: 1,043
- Highest SoF: 4,217
- Average SoF: 1,545
| # |
groupid |
Driver |
Points |
| 1 |
328096 |
Matt Ray |
170 |
| 2 |
343977 |
Dylan Yeager |
162 |
| 3 |
31408 |
Ryan Buhler |
132 |
Week 2
Limaland Motorsports Park
- Total official races: 143
- Total drivers: 1,581
- Unique drivers: 898
- Highest SoF: 4,228
- Average SoF: 1,652
| # |
groupid |
Driver |
Points |
| 1 |
31408 |
Ryan Buhler |
181 |
| 2 |
276130 |
Jeremy Root |
146 |
| 3 |
328096 |
Matt Ray |
140 |
Week 3
USA International Speedway
Dirt
- Total official races: 127
- Total drivers: 1,260
- Unique drivers: 759
- Highest SoF: 3,693
- Average SoF: 1,661
| # |
groupid |
Driver |
Points |
| 1 |
31408 |
Ryan Buhler |
175 |
| 2 |
499508 |
Gunner Harris |
161 |
| 3 |
331660 |
Carter Shank |
150 |
Week 4
Cedar Lake Speedway
- Total official races: 54
- Total drivers: 133
- Unique drivers: 95
- Highest SoF: 4,562
- Average SoF: 1,806
| # |
groupid |
Driver |
Points |
| 1 |
276130 |
Jeremy Root |
165 |
| 2 |
328096 |
Matt Ray |
158 |
| 3 |
331660 |
Carter Shank |
137 |
Week 5
Limaland Motorsports Park
- Total official races: 128
- Total drivers: 1,581
- Unique drivers: 898
- Highest SoF: 3,564
- Average SoF: 1,668
| # |
groupid |
Driver |
Points |
| 1 |
328096 |
Matt Ray |
172 |
| 2 |
331660 |
Carter Shank |
157 |
| 3 |
23722 |
Daniel Hindre |
139 |
Week 6
Lanier National Speedway
Dirt
- Total official races: 124
- Total drivers: 1,873
- Unique drivers: 1,043
- Highest SoF: 2,988
- Average SoF: 1,546
| # |
groupid |
Driver |
Points |
| 1 |
369732 |
Timmy Holmes |
143 |
| 2 |
328096 |
Matt Ray |
140 |
| 3 |
416291 |
Camden Johnston |
131 |
Week 7
USA International Speedway
Dirt
- Total official races: 92
- Total drivers: 1,260
- Unique drivers: 759
- Highest SoF: 3,036
- Average SoF: 1,519
| # |
groupid |
Driver |
Points |
| 1 |
328096 |
Matt Ray |
132 |
| 2 |
179160 |
Jeff Mills |
126 |
| 3 |
466826 |
Easton Lebo |
112 |
- Total official races: 81
- Total drivers: 379
- Unique drivers: 224
- Highest SoF: 3,703
- Average SoF: 1,818
| # |
groupid |
Driver |
Points |
| 1 |
328096 |
Matt Ray |
166 |
| 2 |
276130 |
Jeremy Root |
124 |
| 3 |
553115 |
Cody J Harris |
121 |
Week 9
Limaland Motorsports Park
- Total official races: 81
- Total drivers: 1,581
- Unique drivers: 898
- Highest SoF: 3,220
- Average SoF: 1,544
| # |
groupid |
Driver |
Points |
| 1 |
328096 |
Matt Ray |
148 |
| 2 |
23722 |
Daniel Hindre |
140 |
| 3 |
40474 |
Gerard Green |
136 |
Week 10
Lanier National Speedway
Dirt
- Total official races: 104
- Total drivers: 1,873
- Unique drivers: 1,043
- Highest SoF: 2,427
- Average SoF: 1,451
| # |
groupid |
Driver |
Points |
| 1 |
269242 |
Matthew Ray |
121 |
| 2 |
179160 |
Jeff Mills |
120 |
| 3 |
331660 |
Carter Shank |
110 |
Week 11
USA International Speedway
Dirt
- Total official races: 94
- Total drivers: 1,260
- Unique drivers: 759
- Highest SoF: 2,461
- Average SoF: 1,416
| # |
groupid |
Driver |
Points |
| 1 |
331660 |
Carter Shank |
125 |
| 2 |
179160 |
Jeff Mills |
111 |
| 3 |
328096 |
Matt Ray |
109 |
- Total official races: 44
- Total drivers: 91
- Unique drivers: 79
- Highest SoF: 3,522
- Average SoF: 1,694
| # |
groupid |
Driver |
Points |
| 1 |
328096 |
Matt Ray |
124 |
| 2 |
269242 |
Matthew Ray |
122 |
| 3 |
57859 |
Zachery Dresslaer |
104 |
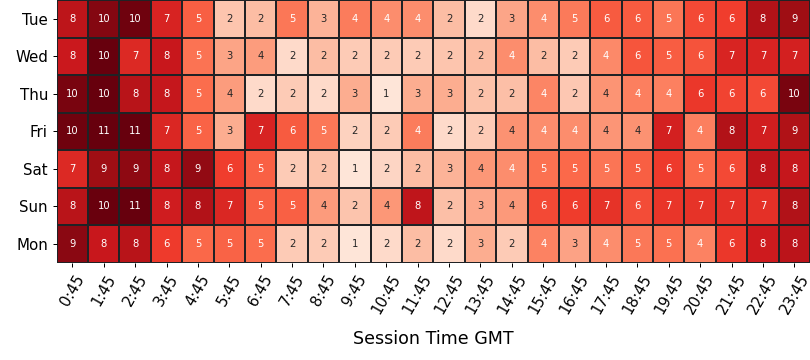
Participation
average number of drivers in each time slot
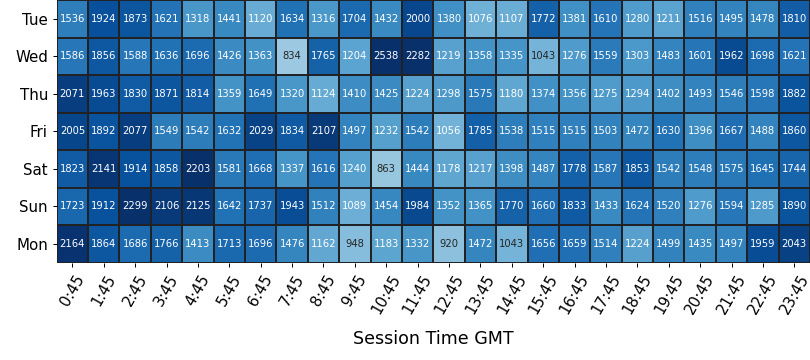
Strength of Field
average SoF of the top split for each time slot
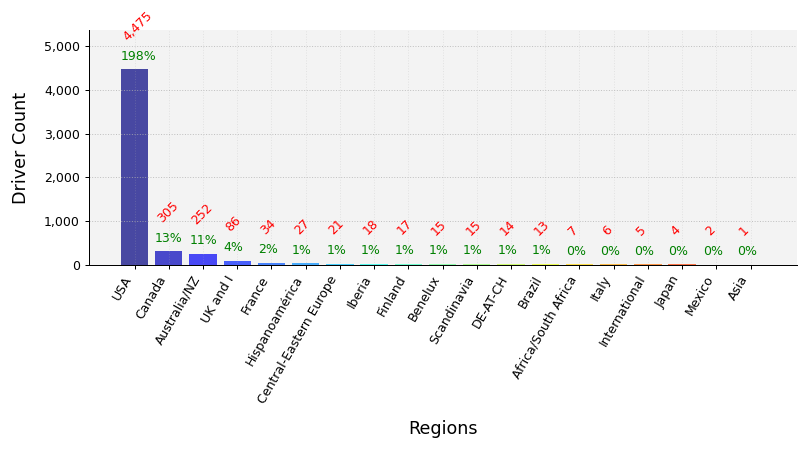
Clubs Distribution
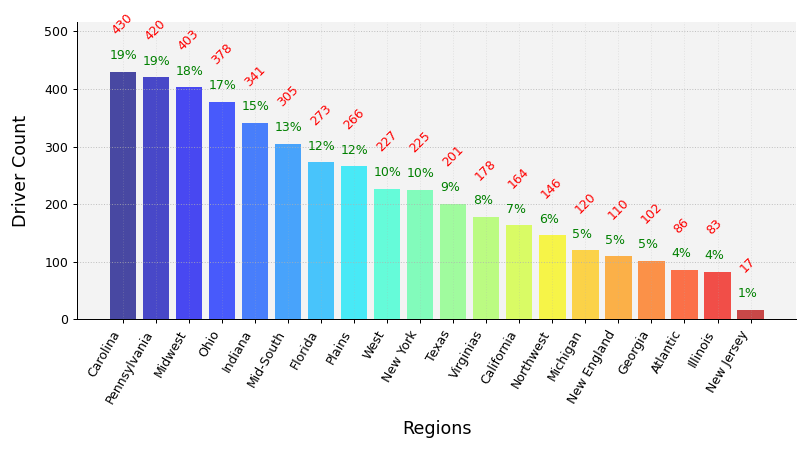
USA Clubs Distribution
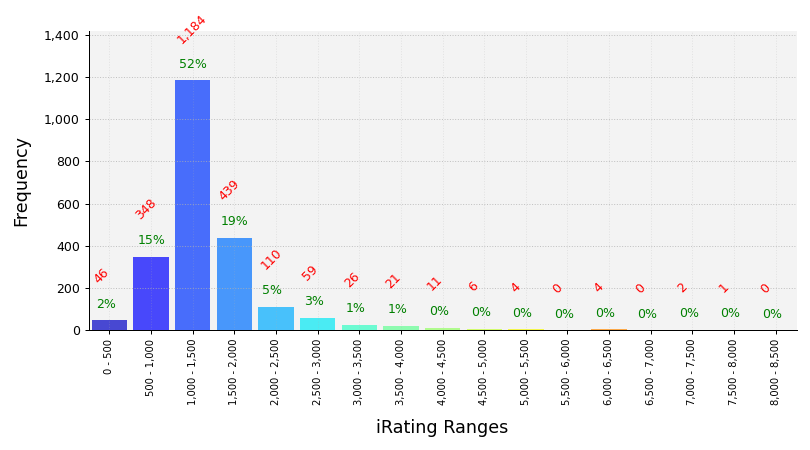
iRating Distribution
Championship Points
| # |
groupid |
Driver |
Points |
| 1 |
328096 |
Matt Ray |
1,226 |
| 2 |
276130 |
Jeremy Root |
1,058 |
| 3 |
331660 |
Carter Shank |
1,030 |
| 4 |
23722 |
Daniel Hindre |
993 |
| 5 |
179160 |
Jeff Mills |
939 |
Most Race Starts
| # |
groupid |
Driver |
Starts |
| 1 |
553115 |
Cody J Harris |
116 |
| 2 |
97492 |
Charles Alexander |
69 |
| 3 |
369593 |
Dylan R Wilson |
66 |
| 4 |
358419 |
Brandon Myers6 |
55 |
| 5 |
179160 |
Jeff Mills |
52 |
Grand Chelems
pole position, won race, fastest lap, led every lap (perfect if 0 inc)
| # |
groupid |
Driver |
Grand Chelems |
Chelem % |
Perfects |
| 1 |
328096 |
Matt Ray |
35 |
84% |
32 |
| 2 |
553115 |
Cody J Harris |
24 |
16% |
19 |
| 3 |
269242 |
Matthew Ray |
23 |
49% |
17 |
| 4 |
369593 |
Dylan R Wilson |
21 |
26% |
17 |
| 5 |
331660 |
Carter Shank |
17 |
35% |
14 |
Average Finish Position
drivers must have raced 8 or more weeks to feature in this table
| # |
groupid |
Driver |
Avg Finish Pos |
Races |
| 1 |
328096 |
Matt Ray |
1.1 |
38 |
| 2 |
269242 |
Matthew Ray |
1.3 |
35 |
| 3 |
331660 |
Carter Shank |
1.7 |
40 |
| 4 |
34713 |
Anthony Collins |
1.9 |
10 |
| 5 |
553115 |
Cody J Harris |
2.1 |
116 |
Most Wins
| # |
groupid |
Driver |
Wins |
| 1 |
553115 |
Cody J Harris |
48 |
| 2 |
328096 |
Matt Ray |
36 |
| 3 |
369593 |
Dylan R Wilson |
36 |
| 4 |
269242 |
Matthew Ray |
29 |
| 5 |
331660 |
Carter Shank |
25 |
Most Podiums
| # |
groupid |
Driver |
Podiums |
| 1 |
553115 |
Cody J Harris |
104 |
| 2 |
369593 |
Dylan R Wilson |
50 |
| 3 |
97492 |
Charles Alexander |
50 |
| 4 |
358419 |
Brandon Myers6 |
39 |
| 5 |
276130 |
Jeremy Root |
38 |
Most Poles
| # |
groupid |
Driver |
Poles |
| 1 |
553115 |
Cody J Harris |
42 |
| 2 |
328096 |
Matt Ray |
36 |
| 3 |
369593 |
Dylan R Wilson |
36 |
| 4 |
358419 |
Brandon Myers6 |
28 |
| 5 |
269242 |
Matthew Ray |
24 |
Best Win Percentage
drivers must have raced 8 or more weeks to feature in this table
| # |
groupid |
Driver |
Win % |
Races |
| 1 |
328096 |
Matt Ray |
95% |
38 |
| 2 |
269242 |
Matthew Ray |
83% |
35 |
| 3 |
331660 |
Carter Shank |
62% |
40 |
| 4 |
23722 |
Daniel Hindre |
62% |
26 |
| 5 |
369593 |
Dylan R Wilson |
55% |
66 |
Best Podium Percentage
drivers must have raced 8 or more weeks to feature in this table
| # |
groupid |
Driver |
Podium % |
Races |
| 1 |
34713 |
Anthony Collins |
100% |
10 |
| 2 |
328096 |
Matt Ray |
97% |
38 |
| 3 |
331660 |
Carter Shank |
95% |
40 |
| 4 |
269242 |
Matthew Ray |
94% |
35 |
| 5 |
553115 |
Cody J Harris |
90% |
116 |
Best Pole Percentage
drivers must have raced 8 or more weeks to feature in this table
| # |
groupid |
Driver |
Pole % |
Races |
| 1 |
328096 |
Matt Ray |
95% |
38 |
| 2 |
269242 |
Matthew Ray |
69% |
35 |
| 3 |
23722 |
Daniel Hindre |
62% |
26 |
| 4 |
331660 |
Carter Shank |
60% |
40 |
| 5 |
369593 |
Dylan R Wilson |
55% |
66 |
Best Average iRating Gains
drivers must have raced 8 or more weeks to feature in this table
| # |
groupid |
Team |
Avg iRating +/- |
Races |
| 1 |
34713 |
Anthony Collins |
58 |
10 |
| 2 |
491189 |
Jason Richardson7 |
39 |
12 |
| 3 |
597062 |
Christopher Robley |
35 |
14 |
| 4 |
23722 |
Daniel Hindre |
34 |
26 |
| 5 |
369593 |
Dylan R Wilson |
28 |
66 |
Highest Total iRating Gains
| # |
groupid |
Team |
iRating +/- |
Races |
| 1 |
369593 |
Dylan R Wilson |
1,879 |
66 |
| 2 |
578830 |
Justin Rivera |
1,180 |
21 |
| 3 |
276130 |
Jeremy Root |
1,051 |
49 |
| 4 |
23722 |
Daniel Hindre |
877 |
26 |
| 5 |
358419 |
Brandon Myers6 |
844 |
55 |
Cleanest Drivers
drivers must have raced 8 or more weeks to feature in this table
| # |
groupid |
Driver |
Inc / Corner |
| 1 |
328096 |
Matt Ray |
0.004 |
| 2 |
34713 |
Anthony Collins |
0.004 |
| 3 |
522278 |
James Lacey3 |
0.006 |
| 4 |
492740 |
Kenny Schaszberger |
0.006 |
| 5 |
331660 |
Carter Shank |
0.009 |