DIRTcar Limited Late Model Series
2021 Season 2
- 6,977 unique drivers averaging 6.79 starts each.
- 490 drivers raced in 8 or more weeks.
- 4,148 official races with an average SOF of 1,572.
- 1,181,970 laps were completed with 115,666 incidents.
Week 1
USA International Speedway
Dirt
- Total official races: 347
- Total drivers: 3,978
- Unique drivers: 1,700
- Highest SoF: 3,928
- Average SoF: 1,531
| # |
groupid |
Driver |
Points |
| 1 |
295661 |
Christopher McGuire |
200 |
| 2 |
365802 |
Adam Holbert |
186 |
| 3 |
252417 |
Craig Gullixson |
170 |
Week 2
Limaland Motorsports Park
- Total official races: 393
- Total drivers: 4,654
- Unique drivers: 1,919
- Highest SoF: 3,389
- Average SoF: 1,522
| # |
groupid |
Driver |
Points |
| 1 |
295661 |
Christopher McGuire |
180 |
| 2 |
344734 |
Richie Yost |
172 |
| 3 |
186476 |
Kenneth Moreland |
167 |
Week 3
Volusia Speedway Park
- Total official races: 423
- Total drivers: 4,845
- Unique drivers: 1,793
- Highest SoF: 3,742
- Average SoF: 1,597
| # |
groupid |
Driver |
Points |
| 1 |
272478 |
Gavin T Taylor |
182 |
| 2 |
269643 |
Jesse Enterkin |
175 |
| 3 |
379315 |
Tyler J Worley |
172 |
- Total official races: 341
- Total drivers: 3,661
- Unique drivers: 1,405
- Highest SoF: 3,233
- Average SoF: 1,609
| # |
groupid |
Driver |
Points |
| 1 |
295661 |
Christopher McGuire |
166 |
| 2 |
424143 |
Kyle Duvall |
157 |
| 3 |
539215 |
Sage Luther |
155 |
Week 5
Weedsport Speedway
- Total official races: 242
- Total drivers: 2,426
- Unique drivers: 1,118
- Highest SoF: 3,469
- Average SoF: 1,760
| # |
groupid |
Driver |
Points |
| 1 |
295661 |
Christopher McGuire |
176 |
| 2 |
60565 |
Maxime Paquette |
165 |
| 3 |
539215 |
Sage Luther |
165 |
Week 6
Lernerville Speedway
- Total official races: 329
- Total drivers: 3,465
- Unique drivers: 1,523
- Highest SoF: 3,540
- Average SoF: 1,623
| # |
groupid |
Driver |
Points |
| 1 |
295661 |
Christopher McGuire |
184 |
| 2 |
187474 |
Austin Mistler |
169 |
| 3 |
573239 |
Scot Granzella |
167 |
- Total official races: 270
- Total drivers: 2,652
- Unique drivers: 1,177
- Highest SoF: 3,976
- Average SoF: 1,654
| # |
groupid |
Driver |
Points |
| 1 |
269643 |
Jesse Enterkin |
189 |
| 2 |
295661 |
Christopher McGuire |
170 |
| 3 |
145156 |
Devon Morgan |
161 |
- Total official races: 385
- Total drivers: 4,320
- Unique drivers: 1,651
- Highest SoF: 3,810
- Average SoF: 1,576
| # |
groupid |
Driver |
Points |
| 1 |
295661 |
Christopher McGuire |
187 |
| 2 |
365802 |
Adam Holbert |
183 |
| 3 |
18392 |
Cale Gale |
166 |
Week 9
Cedar Lake Speedway
- Total official races: 323
- Total drivers: 3,395
- Unique drivers: 1,370
- Highest SoF: 3,417
- Average SoF: 1,644
| # |
groupid |
Driver |
Points |
| 1 |
295661 |
Christopher McGuire |
183 |
| 2 |
384881 |
William Hargreaves |
169 |
| 3 |
591280 |
Will Brown3 |
168 |
Week 10
The Dirt Track at Charlotte
- Total official races: 381
- Total drivers: 4,217
- Unique drivers: 1,609
- Highest SoF: 3,326
- Average SoF: 1,556
| # |
groupid |
Driver |
Points |
| 1 |
325860 |
Jason W Fortier |
177 |
| 2 |
295661 |
Christopher McGuire |
177 |
| 3 |
285220 |
Kody Miller |
163 |
Week 11
Bristol Motor Speedway
Dirt
- Total official races: 440
- Total drivers: 5,136
- Unique drivers: 1,910
- Highest SoF: 3,225
- Average SoF: 1,464
| # |
groupid |
Driver |
Points |
| 1 |
154378 |
Collin Bowden |
174 |
| 2 |
365802 |
Adam Holbert |
162 |
| 3 |
369732 |
Timmy Holmes |
161 |
- Total official races: 405
- Total drivers: 4,597
- Unique drivers: 1,746
- Highest SoF: 3,332
- Average SoF: 1,466
| # |
groupid |
Driver |
Points |
| 1 |
365802 |
Adam Holbert |
175 |
| 2 |
411369 |
Ethan Stoltz |
159 |
| 3 |
610919 |
Daniel Mills5 |
155 |
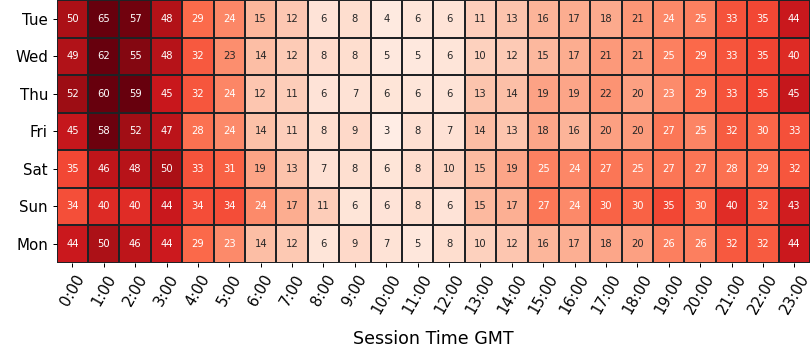
Historical Participation
Participation
average number of drivers in each time slot
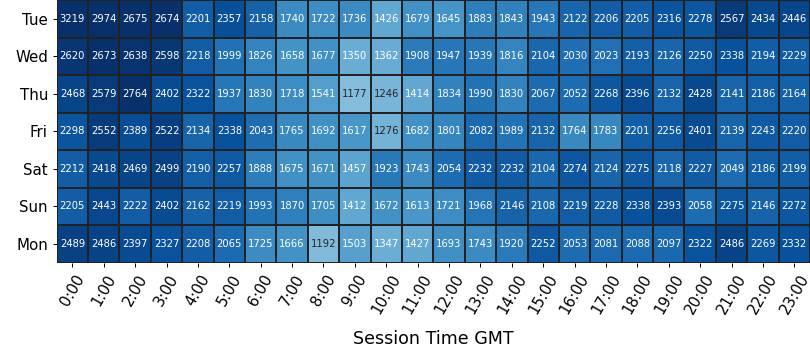
Strength of Field
average SoF of the top split for each time slot
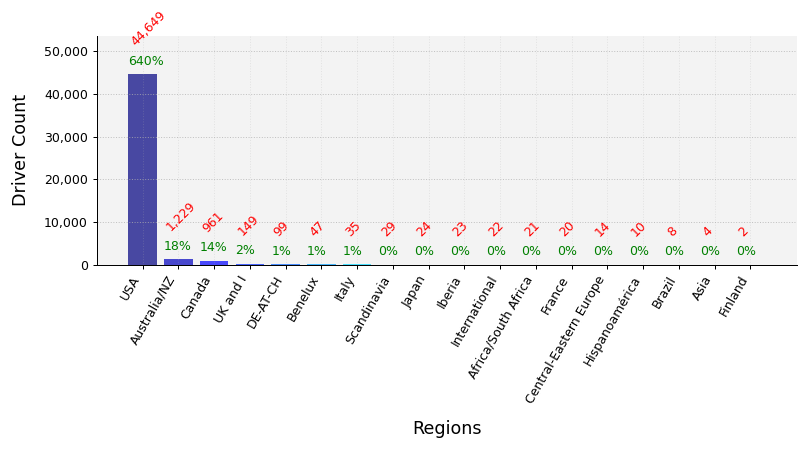
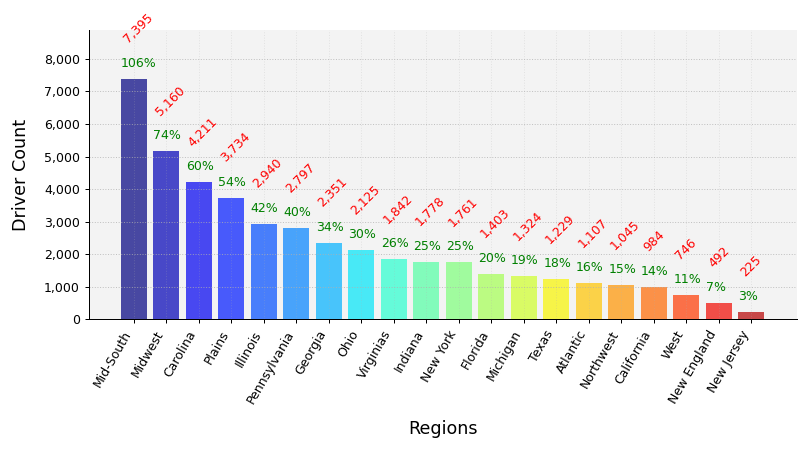
Clubs Distribution
USA Clubs Distribution
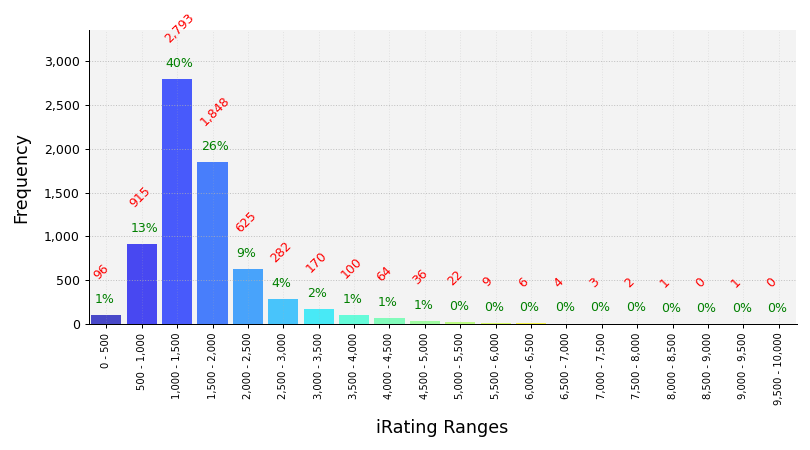
iRating Distribution
Championship Points
| # |
groupid |
Driver |
Points |
| 1 |
295661 |
Christopher McGuire |
1,457 |
| 2 |
365802 |
Adam Holbert |
1,360 |
| 3 |
269643 |
Jesse Enterkin |
1,273 |
| 4 |
482705 |
Brian Dickens |
1,195 |
| 5 |
539215 |
Sage Luther |
1,188 |
Most Race Starts
| # |
groupid |
Driver |
Starts |
| 1 |
606580 |
Lee Plouffe |
251 |
| 2 |
488094 |
Bill Harden |
222 |
| 3 |
506004 |
Jerry Greene |
189 |
| 4 |
614209 |
Tyler M Carter |
165 |
| 5 |
507738 |
Tom Reiter |
163 |
Grand Chelems
pole position, won race, fastest lap, led every lap (perfect if 0 inc)
| # |
groupid |
Driver |
Grand Chelems |
Chelem % |
Perfects |
| 1 |
488112 |
Brent C Evans |
21 |
46% |
18 |
| 2 |
114710 |
Michael Morris6 |
16 |
39% |
11 |
| 3 |
365802 |
Adam Holbert |
15 |
20% |
10 |
| 4 |
435009 |
Collin Rutledge2 |
13 |
35% |
13 |
| 5 |
567737 |
Darren Lillie |
13 |
17% |
12 |
Average Finish Position
drivers must have raced 8 or more weeks to feature in this table
| # |
groupid |
Driver |
Avg Finish Pos |
Races |
| 1 |
488112 |
Brent C Evans |
1.3 |
39 |
| 2 |
365802 |
Adam Holbert |
1.4 |
51 |
| 3 |
114710 |
Michael Morris6 |
1.5 |
28 |
| 4 |
386416 |
Shane Yates |
1.5 |
11 |
| 5 |
295661 |
Christopher McGuire |
1.8 |
12 |
Most Wins
| # |
groupid |
Driver |
Wins |
| 1 |
365802 |
Adam Holbert |
42 |
| 2 |
614209 |
Tyler M Carter |
32 |
| 3 |
488112 |
Brent C Evans |
32 |
| 4 |
567737 |
Darren Lillie |
31 |
| 5 |
269643 |
Jesse Enterkin |
27 |
Most Podiums
| # |
groupid |
Driver |
Podiums |
| 1 |
614209 |
Tyler M Carter |
66 |
| 2 |
506004 |
Jerry Greene |
61 |
| 3 |
606580 |
Lee Plouffe |
55 |
| 4 |
558582 |
Jacob Brittingham |
54 |
| 5 |
488094 |
Bill Harden |
49 |
Most Poles
| # |
groupid |
Driver |
Poles |
| 1 |
614209 |
Tyler M Carter |
38 |
| 2 |
567737 |
Darren Lillie |
29 |
| 3 |
488112 |
Brent C Evans |
29 |
| 4 |
365802 |
Adam Holbert |
27 |
| 5 |
488094 |
Bill Harden |
25 |
Best Win Percentage
drivers must have raced 8 or more weeks to feature in this table
| # |
groupid |
Driver |
Win % |
Races |
| 1 |
295661 |
Christopher McGuire |
83% |
12 |
| 2 |
365802 |
Adam Holbert |
82% |
51 |
| 3 |
488112 |
Brent C Evans |
82% |
39 |
| 4 |
269643 |
Jesse Enterkin |
73% |
37 |
| 5 |
114710 |
Michael Morris6 |
68% |
28 |
Best Podium Percentage
drivers must have raced 8 or more weeks to feature in this table
| # |
groupid |
Driver |
Podium % |
Races |
| 1 |
488112 |
Brent C Evans |
95% |
39 |
| 2 |
365802 |
Adam Holbert |
94% |
51 |
| 3 |
114710 |
Michael Morris6 |
93% |
28 |
| 4 |
269643 |
Jesse Enterkin |
92% |
37 |
| 5 |
295661 |
Christopher McGuire |
92% |
12 |
Best Pole Percentage
drivers must have raced 8 or more weeks to feature in this table
| # |
groupid |
Driver |
Pole % |
Races |
| 1 |
488112 |
Brent C Evans |
74% |
39 |
| 2 |
114710 |
Michael Morris6 |
71% |
28 |
| 3 |
514192 |
Austin Johnson12 |
58% |
36 |
| 4 |
295661 |
Christopher McGuire |
58% |
12 |
| 5 |
273138 |
Nathan R Waddell |
54% |
13 |
Best Average iRating Gains
drivers must have raced 8 or more weeks to feature in this table
| # |
groupid |
Team |
Avg iRating +/- |
Races |
| 1 |
277780 |
Corey Goudeau |
45 |
17 |
| 2 |
68213 |
Thomas Stowers |
37 |
39 |
| 3 |
514192 |
Austin Johnson12 |
36 |
36 |
| 4 |
555114 |
Christopher Swaringim |
33 |
8 |
| 5 |
505231 |
Devon Byrd |
32 |
59 |
Highest Total iRating Gains
| # |
groupid |
Team |
iRating +/- |
Races |
| 1 |
582953 |
Joshua Garris2 |
2,184 |
123 |
| 2 |
439353 |
Tony Miley |
2,027 |
94 |
| 3 |
558582 |
Jacob Brittingham |
2,003 |
150 |
| 4 |
505231 |
Devon Byrd |
1,861 |
59 |
| 5 |
610919 |
Daniel Mills5 |
1,714 |
86 |
Cleanest Drivers
drivers must have raced 8 or more weeks to feature in this table
| # |
groupid |
Driver |
Inc / Corner |
| 1 |
563953 |
Ross Burnett |
0.002 |
| 2 |
187474 |
Austin Mistler |
0.004 |
| 3 |
386416 |
Shane Yates |
0.004 |
| 4 |
488112 |
Brent C Evans |
0.004 |
| 5 |
550373 |
Timothy Measamer |
0.005 |