DIRTcar Pro Late Model Series
2021 Season 2
- 3,717 unique drivers averaging 5.32 starts each.
- 224 drivers raced in 8 or more weeks.
- 1,384 official races with an average SOF of 2,114.
- 454,812 laps were completed with 61,352 incidents.
Week 1
Volusia Speedway Park
- Total official races: 136
- Total drivers: 1,913
- Unique drivers: 893
- Highest SoF: 5,000
- Average SoF: 2,049
| # |
groupid |
Driver |
Points |
| 1 |
343977 |
Dylan Yeager |
252 |
| 2 |
238367 |
Richard Murtaugh Jr. |
237 |
| 3 |
366325 |
Zack McSwain |
235 |
Week 2
The Dirt Track at Charlotte
- Total official races: 162
- Total drivers: 2,409
- Unique drivers: 1,031
- Highest SoF: 5,672
- Average SoF: 2,072
| # |
groupid |
Driver |
Points |
| 1 |
238367 |
Richard Murtaugh Jr. |
289 |
| 2 |
268611 |
Dylan R. Houser |
269 |
| 3 |
366325 |
Zack McSwain |
240 |
Week 3
Weedsport Speedway
- Total official races: 85
- Total drivers: 1,004
- Unique drivers: 497
- Highest SoF: 4,537
- Average SoF: 2,365
| # |
groupid |
Driver |
Points |
| 1 |
238367 |
Richard Murtaugh Jr. |
229 |
| 2 |
366325 |
Zack McSwain |
226 |
| 3 |
343977 |
Dylan Yeager |
213 |
- Total official races: 151
- Total drivers: 2,202
- Unique drivers: 1,019
- Highest SoF: 4,556
- Average SoF: 1,988
| # |
groupid |
Driver |
Points |
| 1 |
478548 |
Aaron Watson3 |
243 |
| 2 |
334645 |
Blake Murray |
226 |
| 3 |
238367 |
Richard Murtaugh Jr. |
220 |
- Total official races: 97
- Total drivers: 1,300
- Unique drivers: 649
- Highest SoF: 4,525
- Average SoF: 2,227
| # |
groupid |
Driver |
Points |
| 1 |
268611 |
Dylan R. Houser |
236 |
| 2 |
343977 |
Dylan Yeager |
234 |
| 3 |
577184 |
Zachary McSwain |
202 |
- Total official races: 135
- Total drivers: 1,833
- Unique drivers: 811
- Highest SoF: 4,895
- Average SoF: 2,087
| # |
groupid |
Driver |
Points |
| 1 |
145156 |
Devon Morgan |
257 |
| 2 |
343977 |
Dylan Yeager |
239 |
| 3 |
238367 |
Richard Murtaugh Jr. |
222 |
Week 7
Bristol Motor Speedway
Dirt
- Total official races: 123
- Total drivers: 1,618
- Unique drivers: 881
- Highest SoF: 3,466
- Average SoF: 1,867
| # |
groupid |
Driver |
Points |
| 1 |
113857 |
Jake Cameron |
178 |
| 2 |
480800 |
Randy Reeser |
176 |
| 3 |
410944 |
Michael Blessing2 |
173 |
- Total official races: 92
- Total drivers: 1,035
- Unique drivers: 540
- Highest SoF: 5,698
- Average SoF: 2,236
| # |
groupid |
Driver |
Points |
| 1 |
274807 |
Davin Cardwell |
204 |
| 2 |
295661 |
Christopher McGuire |
188 |
| 3 |
497341 |
Félix Roy2 |
187 |
Week 9
Lernerville Speedway
- Total official races: 128
- Total drivers: 1,825
- Unique drivers: 775
- Highest SoF: 4,814
- Average SoF: 2,174
| # |
groupid |
Driver |
Points |
| 1 |
343977 |
Dylan Yeager |
243 |
| 2 |
339010 |
Jamie Massey |
226 |
| 3 |
577184 |
Zachary McSwain |
225 |
Week 10
Cedar Lake Speedway
- Total official races: 126
- Total drivers: 1,774
- Unique drivers: 799
- Highest SoF: 4,763
- Average SoF: 2,217
| # |
groupid |
Driver |
Points |
| 1 |
238367 |
Richard Murtaugh Jr. |
236 |
| 2 |
274484 |
Damian Kiefer |
235 |
| 3 |
497341 |
Félix Roy2 |
234 |
Week 11
Limaland Motorsports Park
- Total official races: 135
- Total drivers: 1,811
- Unique drivers: 848
- Highest SoF: 4,491
- Average SoF: 2,031
| # |
groupid |
Driver |
Points |
| 1 |
343977 |
Dylan Yeager |
231 |
| 2 |
369202 |
Huey Quillen |
210 |
| 3 |
243867 |
Brett M Osborn |
208 |
Week 12
Williams Grove Speedway
- Total official races: 82
- Total drivers: 1,037
- Unique drivers: 538
- Highest SoF: 4,938
- Average SoF: 2,301
| # |
groupid |
Driver |
Points |
| 1 |
274807 |
Davin Cardwell |
251 |
| 2 |
238367 |
Richard Murtaugh Jr. |
231 |
| 3 |
299923 |
joshua Walton |
223 |
Historical Participation
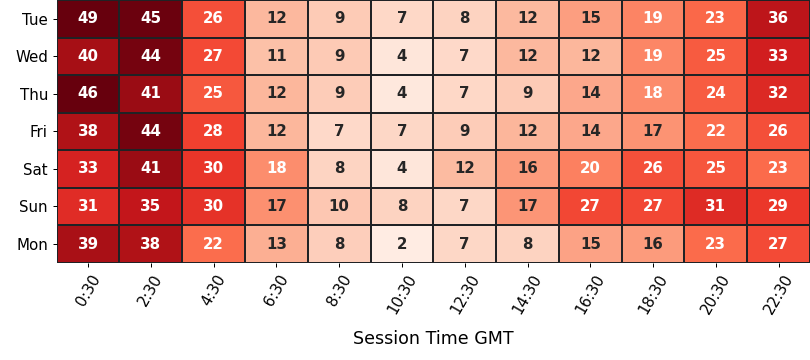
Participation
average number of drivers in each time slot
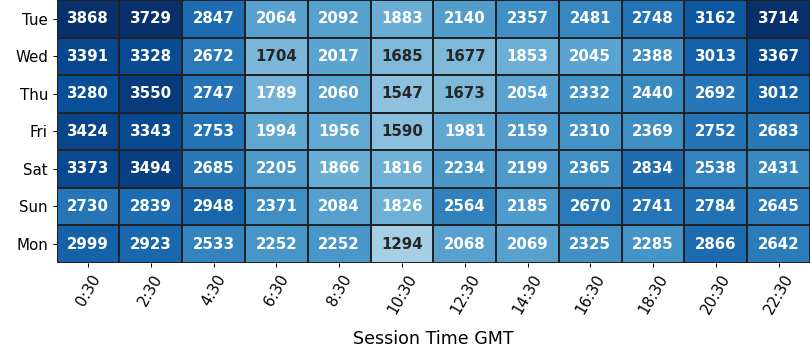
Strength of Field
average SoF of the top split for each time slot
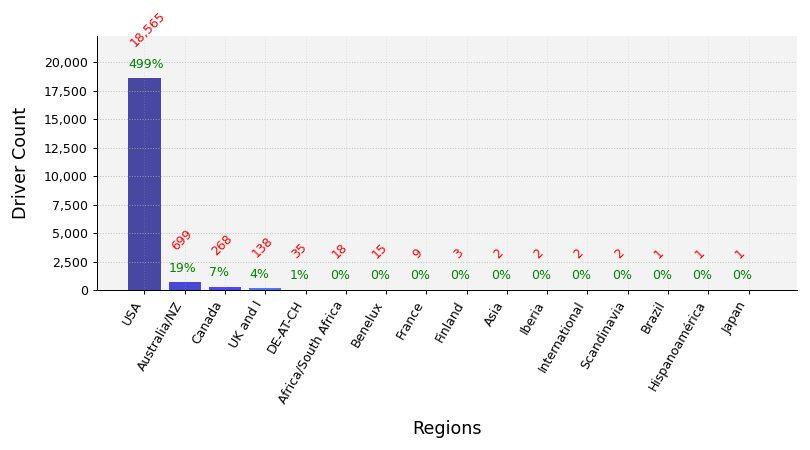
Clubs Distribution
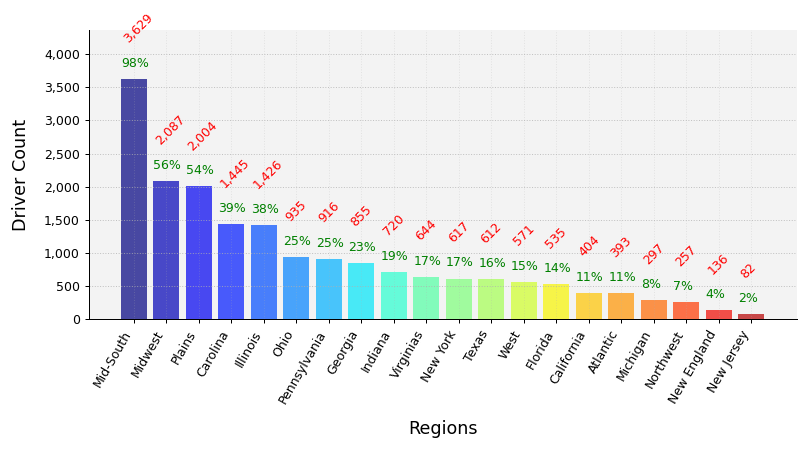
USA Clubs Distribution
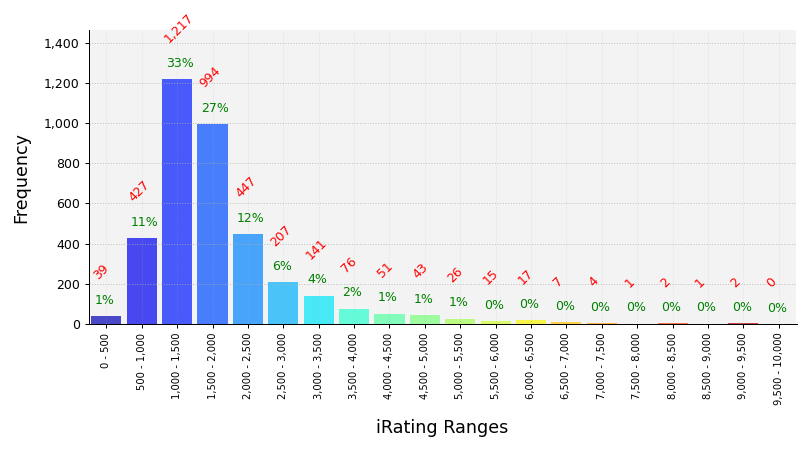
iRating Distribution
Championship Points
| # |
groupid |
Driver |
Points |
| 1 |
238367 |
Richard Murtaugh Jr. |
1,867 |
| 2 |
343977 |
Dylan Yeager |
1,854 |
| 3 |
186657 |
Richard Murtaugh |
1,589 |
| 4 |
497341 |
Félix Roy2 |
1,576 |
| 5 |
577184 |
Zachary McSwain |
1,557 |
Most Race Starts
| # |
groupid |
Driver |
Starts |
| 1 |
269604 |
Robert Hartrum |
174 |
| 2 |
475871 |
Jeremy Urdahl |
143 |
| 3 |
556396 |
Larz Easton |
140 |
| 4 |
556569 |
Matthew Selby |
115 |
| 5 |
293282 |
Tyler Wilfong |
111 |
Grand Chelems
pole position, won race, fastest lap, led every lap (perfect if 0 inc)
| # |
groupid |
Driver |
Grand Chelems |
Chelem % |
Perfects |
| 1 |
186657 |
Richard Murtaugh |
36 |
36% |
30 |
| 2 |
577184 |
Zachary McSwain |
13 |
11% |
9 |
| 3 |
556569 |
Matthew Selby |
12 |
9% |
10 |
| 4 |
274484 |
Damian Kiefer |
8 |
10% |
7 |
| 5 |
475871 |
Jeremy Urdahl |
8 |
4% |
6 |
Average Finish Position
drivers must have raced 8 or more weeks to feature in this table
| # |
groupid |
Driver |
Avg Finish Pos |
Races |
| 1 |
294945 |
Justin Norwood2 |
1.2 |
9 |
| 2 |
497341 |
Félix Roy2 |
1.8 |
28 |
| 3 |
238367 |
Richard Murtaugh Jr. |
2.3 |
31 |
| 4 |
186657 |
Richard Murtaugh |
2.5 |
84 |
| 5 |
369202 |
Huey Quillen |
3.3 |
58 |
Most Wins
| # |
groupid |
Driver |
Wins |
| 1 |
186657 |
Richard Murtaugh |
62 |
| 2 |
577184 |
Zachary McSwain |
36 |
| 3 |
556569 |
Matthew Selby |
31 |
| 4 |
274484 |
Damian Kiefer |
25 |
| 5 |
475871 |
Jeremy Urdahl |
20 |
Most Podiums
| # |
groupid |
Driver |
Podiums |
| 1 |
556569 |
Matthew Selby |
73 |
| 2 |
186657 |
Richard Murtaugh |
71 |
| 3 |
475871 |
Jeremy Urdahl |
65 |
| 4 |
274484 |
Damian Kiefer |
51 |
| 5 |
577184 |
Zachary McSwain |
50 |
Most Poles
| # |
groupid |
Driver |
Poles |
| 1 |
186657 |
Richard Murtaugh |
55 |
| 2 |
577184 |
Zachary McSwain |
34 |
| 3 |
556569 |
Matthew Selby |
32 |
| 4 |
274484 |
Damian Kiefer |
21 |
| 5 |
475871 |
Jeremy Urdahl |
19 |
Best Win Percentage
drivers must have raced 8 or more weeks to feature in this table
| # |
groupid |
Driver |
Win % |
Races |
| 1 |
294945 |
Justin Norwood2 |
78% |
9 |
| 2 |
186657 |
Richard Murtaugh |
74% |
84 |
| 3 |
238367 |
Richard Murtaugh Jr. |
58% |
31 |
| 4 |
497341 |
Félix Roy2 |
54% |
28 |
| 5 |
431755 |
Jeffery Bohannon |
48% |
23 |
Best Podium Percentage
drivers must have raced 8 or more weeks to feature in this table
| # |
groupid |
Driver |
Podium % |
Races |
| 1 |
294945 |
Justin Norwood2 |
100% |
9 |
| 2 |
497341 |
Félix Roy2 |
93% |
28 |
| 3 |
238367 |
Richard Murtaugh Jr. |
90% |
31 |
| 4 |
186657 |
Richard Murtaugh |
85% |
84 |
| 5 |
343977 |
Dylan Yeager |
81% |
31 |
Best Pole Percentage
drivers must have raced 8 or more weeks to feature in this table
| # |
groupid |
Driver |
Pole % |
Races |
| 1 |
294945 |
Justin Norwood2 |
67% |
9 |
| 2 |
186657 |
Richard Murtaugh |
65% |
84 |
| 3 |
497341 |
Félix Roy2 |
46% |
28 |
| 4 |
238367 |
Richard Murtaugh Jr. |
42% |
31 |
| 5 |
577184 |
Zachary McSwain |
40% |
84 |
Best Average iRating Gains
drivers must have raced 8 or more weeks to feature in this table
| # |
groupid |
Team |
Avg iRating +/- |
Races |
| 1 |
294945 |
Justin Norwood2 |
54 |
9 |
| 2 |
577529 |
Sonia Wallace |
37 |
13 |
| 3 |
396724 |
Brady Zemke |
35 |
20 |
| 4 |
559518 |
Cody Nevin |
33 |
19 |
| 5 |
431755 |
Jeffery Bohannon |
33 |
23 |
Highest Total iRating Gains
| # |
groupid |
Team |
iRating +/- |
Races |
| 1 |
276088 |
Chase Hanna |
2,130 |
69 |
| 2 |
556569 |
Matthew Selby |
2,081 |
115 |
| 3 |
438442 |
David Wallis2 |
1,869 |
107 |
| 4 |
293282 |
Tyler Wilfong |
1,615 |
111 |
| 5 |
556396 |
Larz Easton |
1,521 |
140 |
Cleanest Drivers
drivers must have raced 8 or more weeks to feature in this table
| # |
groupid |
Driver |
Inc / Corner |
| 1 |
294945 |
Justin Norwood2 |
0.002 |
| 2 |
186657 |
Richard Murtaugh |
0.007 |
| 3 |
343977 |
Dylan Yeager |
0.008 |
| 4 |
493461 |
Jason Matteson |
0.009 |
| 5 |
336204 |
Mark Scott |
0.009 |