ARCA Menards Series
2021 Season 3
- 16,773 unique drivers averaging 7.07 starts each.
- 923 drivers raced in 8 or more weeks.
- 5,883 official races with an average SOF of 1,519.
- 3,767,772 laps were completed with 385,094 incidents.
Week 1
Chicagoland Speedway
- Total official races: 486
- Total drivers: 9,727
- Unique drivers: 3,470
- Highest SoF: 3,752
- Average SoF: 1,619
| # |
groupid |
Driver |
Points |
| 1 |
29895 |
Jeremy R Allen |
207 |
| 2 |
87205 |
Zack Novak |
206 |
| 3 |
595287 |
Noah Bitz |
203 |
Week 2
Iowa Speedway
Oval
- Total official races: 399
- Total drivers: 7,652
- Unique drivers: 3,109
- Highest SoF: 3,495
- Average SoF: 1,606
| # |
groupid |
Driver |
Points |
| 1 |
240554 |
Justin Yee2 |
191 |
| 2 |
494022 |
James Houghton2 |
191 |
| 3 |
595287 |
Noah Bitz |
190 |
Week 3
Nashville Superspeedway
- Total official races: 438
- Total drivers: 8,587
- Unique drivers: 3,072
- Highest SoF: 4,070
- Average SoF: 1,602
| # |
groupid |
Driver |
Points |
| 1 |
595287 |
Noah Bitz |
229 |
| 2 |
527478 |
Connor Shong |
217 |
| 3 |
17243 |
Josh Berry |
208 |
Week 4
USA International Speedway
Asphalt
- Total official races: 535
- Total drivers: 10,870
- Unique drivers: 4,322
- Highest SoF: 3,594
- Average SoF: 1,467
| # |
groupid |
Driver |
Points |
| 1 |
400858 |
ryan Dunkleberger |
201 |
| 2 |
527478 |
Connor Shong |
192 |
| 3 |
82661 |
Cody Kelley |
190 |
Week 5
Indianapolis Motor Speedway
Oval
- Total official races: 527
- Total drivers: 10,592
- Unique drivers: 4,097
- Highest SoF: 4,553
- Average SoF: 1,538
| # |
groupid |
Driver |
Points |
| 1 |
595287 |
Noah Bitz |
252 |
| 2 |
527478 |
Connor Shong |
240 |
| 3 |
33628 |
Paul Kusheba |
229 |
Week 6
Watkins Glen International
Classic
- Total official races: 314
- Total drivers: 5,598
- Unique drivers: 2,736
- Highest SoF: 2,262
- Average SoF: 1,030
| # |
groupid |
Driver |
Points |
| 1 |
222922 |
Graham A. Bowlin |
122 |
| 2 |
65082 |
Anthony Kernich |
120 |
| 3 |
218791 |
Tyler Garey |
118 |
Week 7
New Hampshire Motor Speedway
Oval
- Total official races: 366
- Total drivers: 6,749
- Unique drivers: 2,749
- Highest SoF: 4,190
- Average SoF: 1,668
| # |
groupid |
Driver |
Points |
| 1 |
62419 |
Malik Ray |
224 |
| 2 |
451344 |
TJ Burske |
215 |
| 3 |
79897 |
Mike Christopher Jr |
214 |
Week 8
Southern National Motorsports Park
- Total official races: 507
- Total drivers: 10,299
- Unique drivers: 3,893
- Highest SoF: 3,970
- Average SoF: 1,505
| # |
groupid |
Driver |
Points |
| 1 |
527478 |
Connor Shong |
225 |
| 2 |
595287 |
Noah Bitz |
214 |
| 3 |
650920 |
AD Wooten |
209 |
Week 9
Charlotte Motor Speedway
Oval - 2018
- Total official races: 821
- Total drivers: 17,724
- Unique drivers: 6,089
- Highest SoF: 4,159
- Average SoF: 1,505
| # |
groupid |
Driver |
Points |
| 1 |
95129 |
Connor Anton |
233 |
| 2 |
62419 |
Malik Ray |
229 |
| 3 |
527478 |
Connor Shong |
226 |
- Total official races: 349
- Total drivers: 6,662
- Unique drivers: 3,033
- Highest SoF: 3,525
- Average SoF: 1,417
| # |
groupid |
Driver |
Points |
| 1 |
139943 |
T Kyle Barnes |
210 |
| 2 |
174171 |
Rafe Slate |
189 |
| 3 |
258068 |
Nick Rehberg |
176 |
Week 11
Rockingham Speedway
Oval
- Total official races: 365
- Total drivers: 6,755
- Unique drivers: 2,485
- Highest SoF: 3,723
- Average SoF: 1,567
| # |
groupid |
Driver |
Points |
| 1 |
44774 |
Mitchell Brighten |
203 |
| 2 |
81076 |
Austin Farr |
198 |
| 3 |
119966 |
Derek Justis |
195 |
Week 12
Michigan International Speedway
- Total official races: 801
- Total drivers: 17,330
- Unique drivers: 4,790
- Highest SoF: 4,192
- Average SoF: 1,562
| # |
groupid |
Driver |
Points |
| 1 |
156749 |
Shawn M. Butler |
241 |
| 2 |
556293 |
Benjamin Frisch |
238 |
| 3 |
316264 |
Max R Brady |
227 |
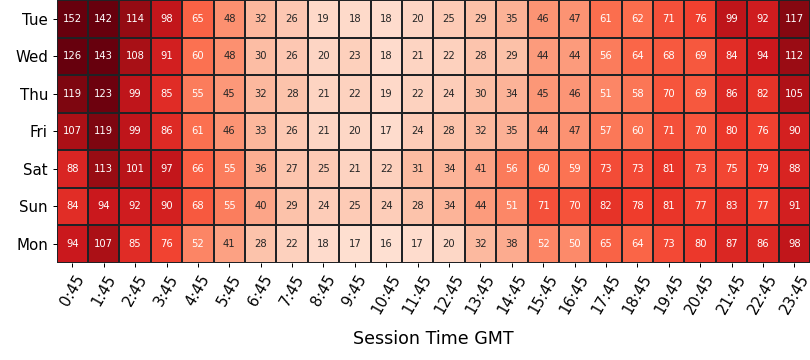
Participation
average number of drivers in each time slot
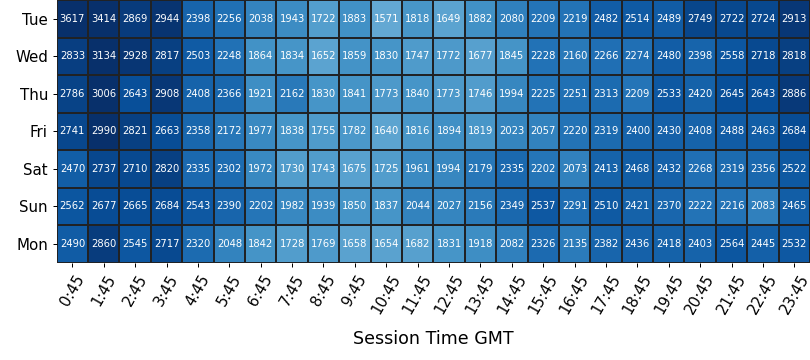
Strength of Field
average SoF of the top split for each time slot
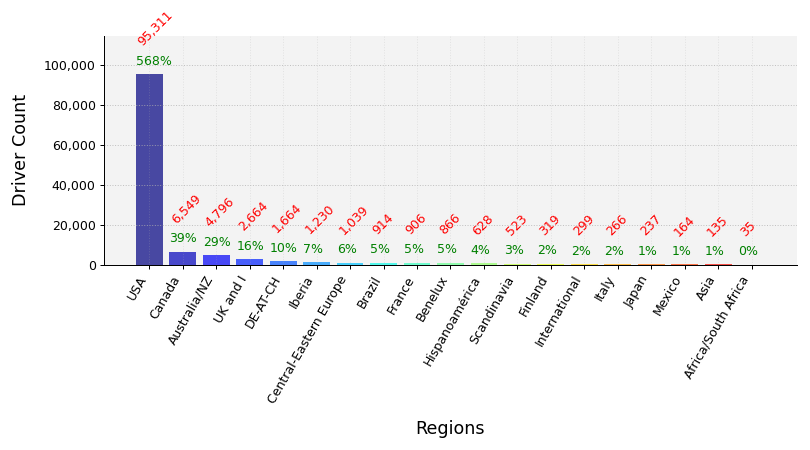
Clubs Distribution
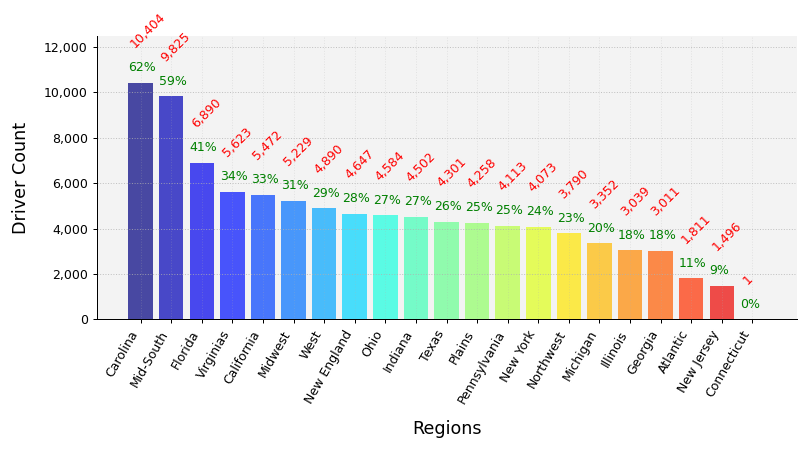
USA Clubs Distribution
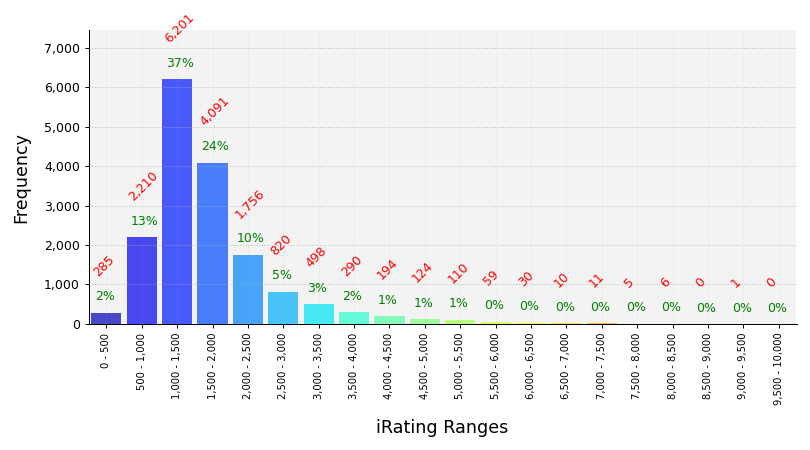
iRating Distribution
Championship Points
| # |
groupid |
Driver |
Points |
| 1 |
595287 |
Noah Bitz |
1,737 |
| 2 |
527478 |
Connor Shong |
1,697 |
| 3 |
309091 |
Phillip Resh |
1,483 |
| 4 |
44774 |
Mitchell Brighten |
1,437 |
| 5 |
108141 |
Tim Sozio |
1,415 |
Most Race Starts
| # |
groupid |
Driver |
Starts |
| 1 |
633609 |
Anthony Scott4 |
353 |
| 2 |
462153 |
Donald Mills |
255 |
| 3 |
587750 |
Peter Otoski |
204 |
| 4 |
339118 |
Colt Cecil |
167 |
| 5 |
574718 |
Ernest Friend |
149 |
Grand Chelems
pole position, won race, fastest lap, led every lap (perfect if 0 inc)
| # |
groupid |
Driver |
Grand Chelems |
Chelem % |
Perfects |
| 1 |
79074 |
Joel Blewitt |
24 |
75% |
21 |
| 2 |
65082 |
Anthony Kernich |
17 |
36% |
16 |
| 3 |
389366 |
Jaycob Schuffert |
17 |
29% |
16 |
| 4 |
271947 |
Dylan Ault |
16 |
75% |
15 |
| 5 |
15775 |
Rob Lee |
14 |
25% |
12 |
Average Finish Position
drivers must have raced 8 or more weeks to feature in this table
| # |
groupid |
Driver |
Avg Finish Pos |
Races |
| 1 |
108141 |
Tim Sozio |
1.7 |
28 |
| 2 |
65082 |
Anthony Kernich |
2.2 |
44 |
| 3 |
527478 |
Connor Shong |
2.2 |
14 |
| 4 |
337564 |
Gordon Koerner |
2.4 |
40 |
| 5 |
133486 |
Manuela Balloni |
2.5 |
8 |
Most Wins
| # |
groupid |
Driver |
Wins |
| 1 |
366943 |
Charlton Milley |
41 |
| 2 |
531441 |
Robert M De Jersey |
34 |
| 3 |
401738 |
Dmitry Eniseev2 |
32 |
| 4 |
423679 |
Michael Rosero |
32 |
| 5 |
389366 |
Jaycob Schuffert |
31 |
Most Podiums
| # |
groupid |
Driver |
Podiums |
| 1 |
34729 |
Stevie Minson |
64 |
| 2 |
413720 |
Benjamin A White |
59 |
| 3 |
423679 |
Michael Rosero |
59 |
| 4 |
366943 |
Charlton Milley |
57 |
| 5 |
401738 |
Dmitry Eniseev2 |
50 |
Most Poles
| # |
groupid |
Driver |
Poles |
| 1 |
366943 |
Charlton Milley |
56 |
| 2 |
413720 |
Benjamin A White |
42 |
| 3 |
423679 |
Michael Rosero |
35 |
| 4 |
15775 |
Rob Lee |
33 |
| 5 |
531441 |
Robert M De Jersey |
31 |
Best Win Percentage
drivers must have raced 8 or more weeks to feature in this table
| # |
groupid |
Driver |
Win % |
Races |
| 1 |
315887 |
River Hays |
75% |
16 |
| 2 |
108141 |
Tim Sozio |
61% |
28 |
| 3 |
372566 |
Tom Zey |
58% |
33 |
| 4 |
389366 |
Jaycob Schuffert |
56% |
55 |
| 5 |
531441 |
Robert M De Jersey |
53% |
64 |
Best Podium Percentage
drivers must have raced 8 or more weeks to feature in this table
| # |
groupid |
Driver |
Podium % |
Races |
| 1 |
65082 |
Anthony Kernich |
93% |
44 |
| 2 |
108141 |
Tim Sozio |
93% |
28 |
| 3 |
33381 |
Alex Kan |
86% |
28 |
| 4 |
527478 |
Connor Shong |
86% |
14 |
| 5 |
337564 |
Gordon Koerner |
82% |
40 |
Best Pole Percentage
drivers must have raced 8 or more weeks to feature in this table
| # |
groupid |
Driver |
Pole % |
Races |
| 1 |
315887 |
River Hays |
69% |
16 |
| 2 |
65082 |
Anthony Kernich |
68% |
44 |
| 3 |
108141 |
Tim Sozio |
64% |
28 |
| 4 |
527478 |
Connor Shong |
57% |
14 |
| 5 |
357376 |
Calvin A Allison |
53% |
19 |
Best Average iRating Gains
drivers must have raced 8 or more weeks to feature in this table
| # |
groupid |
Team |
Avg iRating +/- |
Races |
| 1 |
133486 |
Manuela Balloni |
81 |
8 |
| 2 |
527148 |
Aiden Schultz |
54 |
20 |
| 3 |
31587 |
Kevin Corsius |
51 |
18 |
| 4 |
555114 |
Christopher Swaringim |
44 |
12 |
| 5 |
549830 |
Christopher Fathke |
44 |
11 |
Highest Total iRating Gains
| # |
groupid |
Team |
iRating +/- |
Races |
| 1 |
413720 |
Benjamin A White |
3,727 |
105 |
| 2 |
366943 |
Charlton Milley |
2,526 |
84 |
| 3 |
404096 |
Jason Overton |
2,078 |
50 |
| 4 |
51876 |
Tom Miles2 |
1,988 |
74 |
| 5 |
258902 |
Jackson Menchu |
1,848 |
25 |
Cleanest Drivers
drivers must have raced 8 or more weeks to feature in this table
| # |
groupid |
Driver |
Inc / Corner |
| 1 |
40001 |
Frank Russell |
0.000 |
| 2 |
61809 |
Jim Schofield |
0.000 |
| 3 |
366347 |
Ethyn Reasoner |
0.000 |
| 4 |
65082 |
Anthony Kernich |
0.001 |
| 5 |
273218 |
Eric Edison |
0.001 |