RYCO-Motorsports.com DIRTcar Pro Late Model Series
2021 Season 3
- 3,655 unique drivers averaging 5.69 starts each.
- 261 drivers raced in 8 or more weeks.
- 1,429 official races with an average SOF of 2,185.
- 478,316 laps were completed with 56,840 incidents.
Week 1
Volusia Speedway Park
- Total official races: 169
- Total drivers: 2,547
- Unique drivers: 1,097
- Highest SoF: 4,448
- Average SoF: 2,076
| # |
groupid |
Driver |
Points |
| 1 |
238367 |
Richard Murtaugh Jr. |
237 |
| 2 |
374481 |
Brent D Carter |
220 |
| 3 |
328296 |
James Braswell Jr |
213 |
Week 2
The Dirt Track at Charlotte
- Total official races: 163
- Total drivers: 2,435
- Unique drivers: 1,051
- Highest SoF: 4,449
- Average SoF: 2,191
| # |
groupid |
Driver |
Points |
| 1 |
343977 |
Dylan Yeager |
241 |
| 2 |
334645 |
Blake Murray |
225 |
| 3 |
238367 |
Richard Murtaugh Jr. |
218 |
Week 3
Weedsport Speedway
- Total official races: 88
- Total drivers: 1,013
- Unique drivers: 552
- Highest SoF: 4,791
- Average SoF: 2,362
| # |
groupid |
Driver |
Points |
| 1 |
274807 |
Davin Cardwell |
236 |
| 2 |
239931 |
Trevor Throne |
220 |
| 3 |
319065 |
Eric Keller |
216 |
- Total official races: 165
- Total drivers: 2,475
- Unique drivers: 1,115
- Highest SoF: 5,350
- Average SoF: 2,169
| # |
groupid |
Driver |
Points |
| 1 |
330143 |
Evan Seay |
276 |
| 2 |
238367 |
Richard Murtaugh Jr. |
257 |
| 3 |
541993 |
Mike Augustine |
248 |
- Total official races: 105
- Total drivers: 1,369
- Unique drivers: 677
- Highest SoF: 4,925
- Average SoF: 2,464
| # |
groupid |
Driver |
Points |
| 1 |
343977 |
Dylan Yeager |
240 |
| 2 |
330143 |
Evan Seay |
233 |
| 3 |
274484 |
Damian Kiefer |
230 |
- Total official races: 147
- Total drivers: 2,047
- Unique drivers: 917
- Highest SoF: 4,690
- Average SoF: 2,168
| # |
groupid |
Driver |
Points |
| 1 |
238367 |
Richard Murtaugh Jr. |
236 |
| 2 |
345169 |
Paul Hollander |
232 |
| 3 |
186657 |
Richard Murtaugh |
231 |
Week 7
Lanier National Speedway
Dirt
- Total official races: 153
- Total drivers: 2,242
- Unique drivers: 1,035
- Highest SoF: 4,392
- Average SoF: 2,134
| # |
groupid |
Driver |
Points |
| 1 |
295661 |
Christopher McGuire |
238 |
| 2 |
577184 |
Zachary McSwain |
224 |
| 3 |
18997 |
Justin Thompson |
223 |
- Total official races: 90
- Total drivers: 1,130
- Unique drivers: 563
- Highest SoF: 4,929
- Average SoF: 2,302
| # |
groupid |
Driver |
Points |
| 1 |
334645 |
Blake Murray |
232 |
| 2 |
343977 |
Dylan Yeager |
222 |
| 3 |
274484 |
Damian Kiefer |
215 |
Week 9
Lernerville Speedway
- Total official races: 120
- Total drivers: 1,470
- Unique drivers: 730
- Highest SoF: 4,767
- Average SoF: 2,150
| # |
groupid |
Driver |
Points |
| 1 |
577184 |
Zachary McSwain |
241 |
| 2 |
274484 |
Damian Kiefer |
231 |
| 3 |
369202 |
Huey Quillen |
225 |
Week 10
Cedar Lake Speedway
- Total official races: 118
- Total drivers: 1,533
- Unique drivers: 761
- Highest SoF: 4,752
- Average SoF: 2,130
| # |
groupid |
Driver |
Points |
| 1 |
473728 |
Mike Fritz |
263 |
| 2 |
274484 |
Damian Kiefer |
251 |
| 3 |
339010 |
Jamie Massey |
218 |
Week 11
Limaland Motorsports Park
- Total official races: 125
- Total drivers: 1,614
- Unique drivers: 803
- Highest SoF: 4,513
- Average SoF: 2,067
| # |
groupid |
Driver |
Points |
| 1 |
410944 |
Michael Blessing2 |
252 |
| 2 |
73390 |
Josh Thoma |
235 |
| 3 |
577184 |
Zachary McSwain |
225 |
Week 12
Williams Grove Speedway
- Total official races: 85
- Total drivers: 929
- Unique drivers: 486
- Highest SoF: 5,140
- Average SoF: 2,195
| # |
groupid |
Driver |
Points |
| 1 |
23734 |
Justin Norwood |
268 |
| 2 |
274484 |
Damian Kiefer |
250 |
| 3 |
350875 |
Casey Brunson2 |
247 |
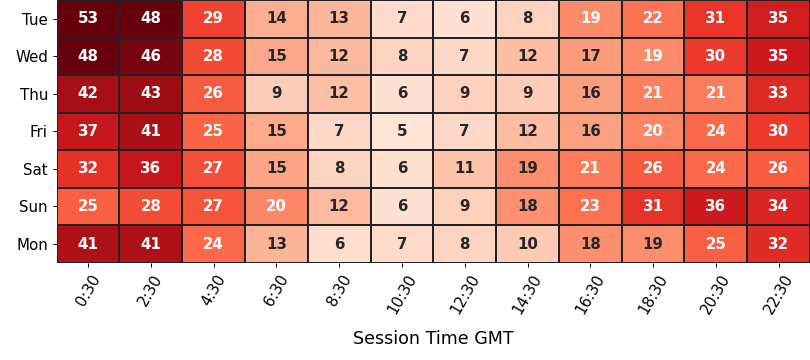
Participation
average number of drivers in each time slot
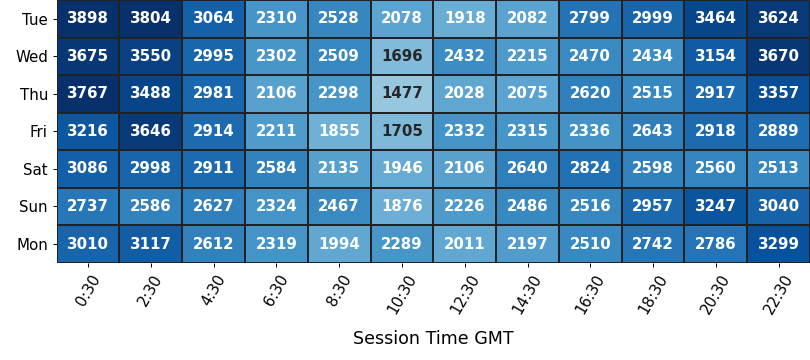
Strength of Field
average SoF of the top split for each time slot
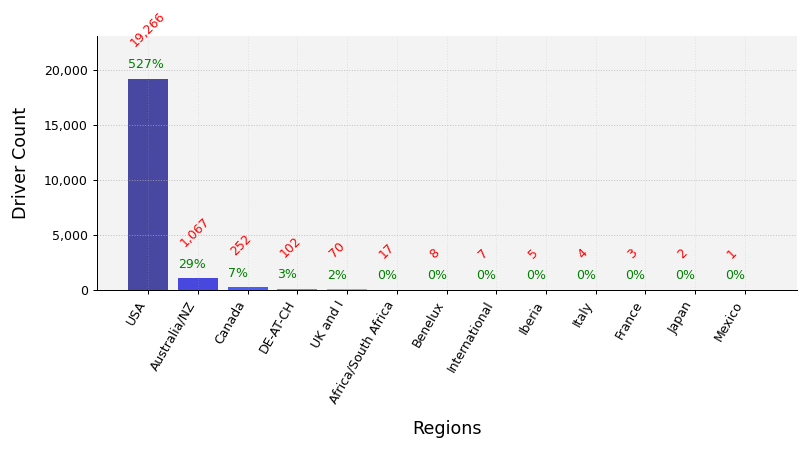
Clubs Distribution
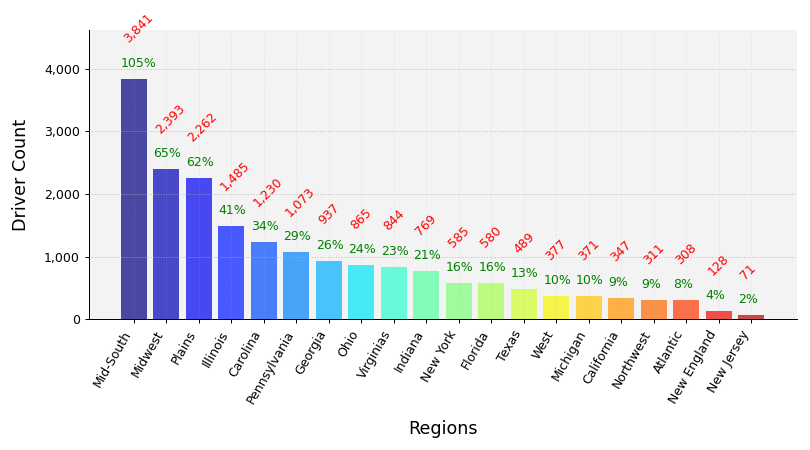
USA Clubs Distribution
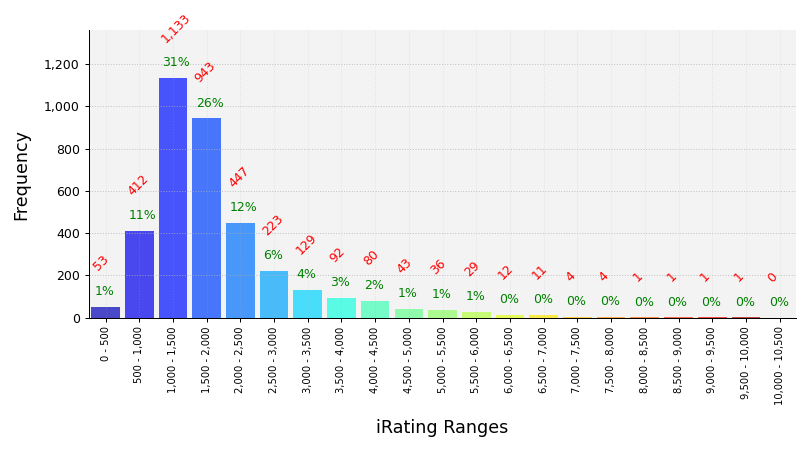
iRating Distribution
Championship Points
| # |
groupid |
Driver |
Points |
| 1 |
274484 |
Damian Kiefer |
1,820 |
| 2 |
343977 |
Dylan Yeager |
1,760 |
| 3 |
577184 |
Zachary McSwain |
1,739 |
| 4 |
334645 |
Blake Murray |
1,681 |
| 5 |
369202 |
Huey Quillen |
1,641 |
Most Race Starts
| # |
groupid |
Driver |
Starts |
| 1 |
621653 |
Kevin Hill9 |
175 |
| 2 |
418707 |
Colton Zimmer |
146 |
| 3 |
475871 |
Jeremy Urdahl |
127 |
| 4 |
597556 |
Brayden Burnett |
124 |
| 5 |
421713 |
Jayden Kraus |
103 |
Grand Chelems
pole position, won race, fastest lap, led every lap (perfect if 0 inc)
| # |
groupid |
Driver |
Grand Chelems |
Chelem % |
Perfects |
| 1 |
268611 |
Dylan R. Houser |
21 |
19% |
15 |
| 2 |
281243 |
Keith Hackney |
14 |
29% |
14 |
| 3 |
274484 |
Damian Kiefer |
13 |
24% |
12 |
| 4 |
508479 |
Todd J Atkins |
12 |
22% |
11 |
| 5 |
493799 |
Ellis Rogers |
9 |
47% |
9 |
Average Finish Position
drivers must have raced 8 or more weeks to feature in this table
| # |
groupid |
Driver |
Avg Finish Pos |
Races |
| 1 |
343977 |
Dylan Yeager |
1.9 |
19 |
| 2 |
294945 |
Justin Norwood2 |
2.0 |
22 |
| 3 |
563461 |
Josh Fuller |
2.6 |
33 |
| 4 |
508479 |
Todd J Atkins |
2.6 |
49 |
| 5 |
274484 |
Damian Kiefer |
2.8 |
49 |
Most Wins
| # |
groupid |
Driver |
Wins |
| 1 |
268611 |
Dylan R. Houser |
41 |
| 2 |
418707 |
Colton Zimmer |
29 |
| 3 |
508479 |
Todd J Atkins |
29 |
| 4 |
274484 |
Damian Kiefer |
25 |
| 5 |
281243 |
Keith Hackney |
25 |
Most Podiums
| # |
groupid |
Driver |
Podiums |
| 1 |
418707 |
Colton Zimmer |
77 |
| 2 |
268611 |
Dylan R. Houser |
64 |
| 3 |
475871 |
Jeremy Urdahl |
53 |
| 4 |
274484 |
Damian Kiefer |
40 |
| 5 |
15598 |
Marvin Aulmann |
39 |
Most Poles
| # |
groupid |
Driver |
Poles |
| 1 |
268611 |
Dylan R. Houser |
34 |
| 2 |
274484 |
Damian Kiefer |
26 |
| 3 |
281243 |
Keith Hackney |
22 |
| 4 |
563461 |
Josh Fuller |
22 |
| 5 |
577184 |
Zachary McSwain |
20 |
Best Win Percentage
drivers must have raced 8 or more weeks to feature in this table
| # |
groupid |
Driver |
Win % |
Races |
| 1 |
343977 |
Dylan Yeager |
63% |
19 |
| 2 |
508479 |
Todd J Atkins |
59% |
49 |
| 3 |
268611 |
Dylan R. Houser |
53% |
77 |
| 4 |
281243 |
Keith Hackney |
52% |
48 |
| 5 |
274484 |
Damian Kiefer |
51% |
49 |
Best Podium Percentage
drivers must have raced 8 or more weeks to feature in this table
| # |
groupid |
Driver |
Podium % |
Races |
| 1 |
294945 |
Justin Norwood2 |
95% |
22 |
| 2 |
343977 |
Dylan Yeager |
89% |
19 |
| 3 |
268611 |
Dylan R. Houser |
83% |
77 |
| 4 |
274484 |
Damian Kiefer |
82% |
49 |
| 5 |
563461 |
Josh Fuller |
82% |
33 |
Best Pole Percentage
drivers must have raced 8 or more weeks to feature in this table
| # |
groupid |
Driver |
Pole % |
Races |
| 1 |
563461 |
Josh Fuller |
67% |
33 |
| 2 |
274484 |
Damian Kiefer |
53% |
49 |
| 3 |
281243 |
Keith Hackney |
46% |
48 |
| 4 |
488112 |
Brent C Evans |
45% |
20 |
| 5 |
268611 |
Dylan R. Houser |
44% |
77 |
Best Average iRating Gains
drivers must have raced 8 or more weeks to feature in this table
| # |
groupid |
Team |
Avg iRating +/- |
Races |
| 1 |
563461 |
Josh Fuller |
41 |
33 |
| 2 |
551835 |
Jon Darby |
34 |
24 |
| 3 |
294945 |
Justin Norwood2 |
34 |
22 |
| 4 |
243867 |
Brett M Osborn |
33 |
31 |
| 5 |
422254 |
Adam Zellmer |
31 |
21 |
Highest Total iRating Gains
| # |
groupid |
Team |
iRating +/- |
Races |
| 1 |
621653 |
Kevin Hill9 |
1,564 |
175 |
| 2 |
421713 |
Jayden Kraus |
1,369 |
103 |
| 3 |
379782 |
Jonah Perkins2 |
1,353 |
78 |
| 4 |
563461 |
Josh Fuller |
1,337 |
33 |
| 5 |
542228 |
Chase B Hill |
1,298 |
74 |
Cleanest Drivers
drivers must have raced 8 or more weeks to feature in this table
| # |
groupid |
Driver |
Inc / Corner |
| 1 |
563461 |
Josh Fuller |
0.004 |
| 2 |
281243 |
Keith Hackney |
0.006 |
| 3 |
294945 |
Justin Norwood2 |
0.006 |
| 4 |
336204 |
Mark Scott |
0.007 |
| 5 |
105957 |
Russell J Berry |
0.007 |