Late Model Tour - Fixed
2021 Season 3
- 5,708 unique drivers averaging 3.41 starts each.
- 183 drivers raced in 8 or more weeks.
- 1,602 official races with an average SOF of 1,491.
- 777,363 laps were completed with 67,006 incidents.
Week 1
Southern National Motorsports Park
- Total official races: 168
- Total drivers: 2,054
- Unique drivers: 1,190
- Highest SoF: 3,365
- Average SoF: 1,536
| # |
groupid |
Driver |
Points |
| 1 |
315887 |
River Hays |
171 |
| 2 |
494022 |
James Houghton2 |
157 |
| 3 |
589088 |
Rena Tate2 |
154 |
Week 2
Oxford Plains Speedway
- Total official races: 142
- Total drivers: 1,519
- Unique drivers: 984
- Highest SoF: 3,402
- Average SoF: 1,470
| # |
groupid |
Driver |
Points |
| 1 |
315887 |
River Hays |
149 |
| 2 |
222356 |
Jean-Philippe Bergeron |
139 |
| 3 |
386356 |
Parker Retzlaff2 |
138 |
- Total official races: 138
- Total drivers: 1,540
- Unique drivers: 1,035
- Highest SoF: 3,467
- Average SoF: 1,544
| # |
groupid |
Driver |
Points |
| 1 |
586666 |
Ryan Matthews3 |
185 |
| 2 |
227887 |
Tyler DiVenanzo |
170 |
| 3 |
315887 |
River Hays |
167 |
Week 4
Myrtle Beach Speedway
- Total official races: 117
- Total drivers: 1,155
- Unique drivers: 733
- Highest SoF: 3,575
- Average SoF: 1,618
| # |
groupid |
Driver |
Points |
| 1 |
65002 |
Hurtley Dean |
180 |
| 2 |
315887 |
River Hays |
170 |
| 3 |
134640 |
James Linkiewicz |
165 |
Week 5
Lanier National Speedway
Asphalt
- Total official races: 157
- Total drivers: 1,866
- Unique drivers: 1,096
- Highest SoF: 3,632
- Average SoF: 1,448
| # |
groupid |
Driver |
Points |
| 1 |
315887 |
River Hays |
190 |
| 2 |
167058 |
Ryan Joyner |
175 |
| 3 |
237982 |
Chris Norconk |
160 |
Week 6
The Milwaukee Mile
- Total official races: 121
- Total drivers: 1,306
- Unique drivers: 734
- Highest SoF: 3,702
- Average SoF: 1,469
| # |
groupid |
Driver |
Points |
| 1 |
315887 |
River Hays |
191 |
| 2 |
103668 |
Matthew Brinson |
176 |
| 3 |
314277 |
Marcus Fruchtenicht |
168 |
Week 7
Martinsville Speedway
- Total official races: 120
- Total drivers: 1,376
- Unique drivers: 868
- Highest SoF: 4,461
- Average SoF: 1,669
| # |
groupid |
Driver |
Points |
| 1 |
265916 |
Drew Wooten |
186 |
| 2 |
306027 |
Garrett Pick |
167 |
| 3 |
315887 |
River Hays |
161 |
Week 8
South Boston Speedway
- Total official races: 177
- Total drivers: 2,128
- Unique drivers: 1,271
- Highest SoF: 3,442
- Average SoF: 1,397
| # |
groupid |
Driver |
Points |
| 1 |
193113 |
Daniel Folds |
185 |
| 2 |
532601 |
Kyle Myer |
170 |
| 3 |
103668 |
Matthew Brinson |
162 |
- Total official races: 136
- Total drivers: 1,513
- Unique drivers: 1,003
- Highest SoF: 2,837
- Average SoF: 1,395
| # |
groupid |
Driver |
Points |
| 1 |
133913 |
Dave Coursol |
156 |
| 2 |
586666 |
Ryan Matthews3 |
154 |
| 3 |
38067 |
Brenden Queen |
141 |
Week 10
Five Flags Speedway
- Total official races: 117
- Total drivers: 1,184
- Unique drivers: 741
- Highest SoF: 3,393
- Average SoF: 1,524
| # |
groupid |
Driver |
Points |
| 1 |
315887 |
River Hays |
195 |
| 2 |
589088 |
Rena Tate2 |
181 |
| 3 |
62761 |
Riley Halverson II |
167 |
Week 11
Nashville Fairgrounds Speedway
Oval
- Total official races: 123
- Total drivers: 1,238
- Unique drivers: 716
- Highest SoF: 3,134
- Average SoF: 1,519
| # |
groupid |
Driver |
Points |
| 1 |
315887 |
River Hays |
177 |
| 2 |
265916 |
Drew Wooten |
177 |
| 3 |
320140 |
Riley J Stenjem |
171 |
Week 12
USA International Speedway
Asphalt
- Total official races: 204
- Total drivers: 2,591
- Unique drivers: 1,518
- Highest SoF: 3,066
- Average SoF: 1,407
| # |
groupid |
Driver |
Points |
| 1 |
651898 |
Ty Hudskin |
177 |
| 2 |
82661 |
Cody Kelley |
175 |
| 3 |
494232 |
Brendan R Lee |
168 |
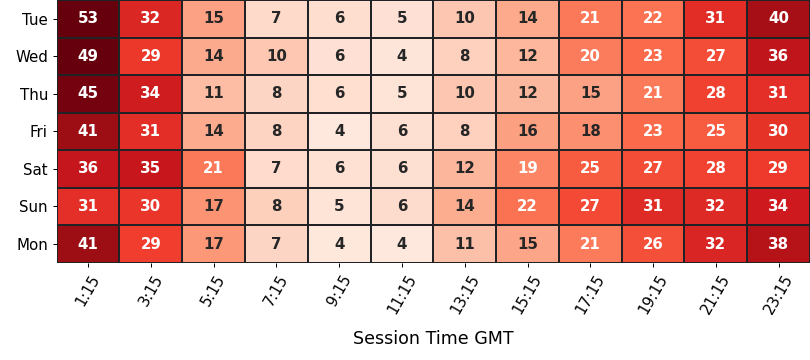
Participation
average number of drivers in each time slot
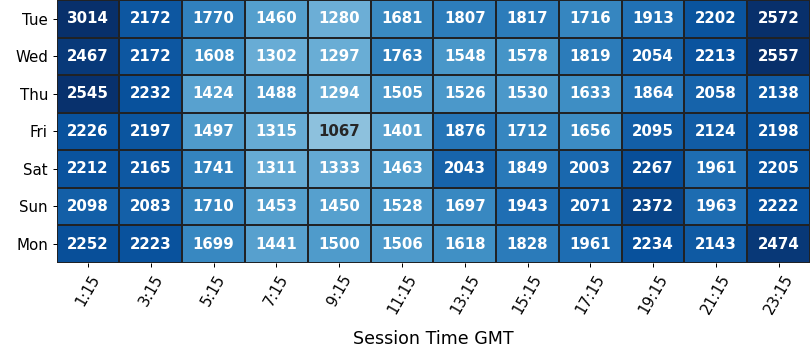
Strength of Field
average SoF of the top split for each time slot
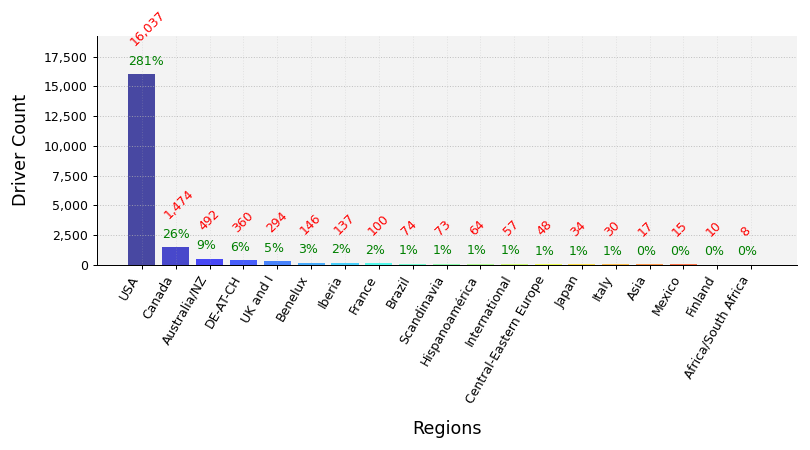
Clubs Distribution
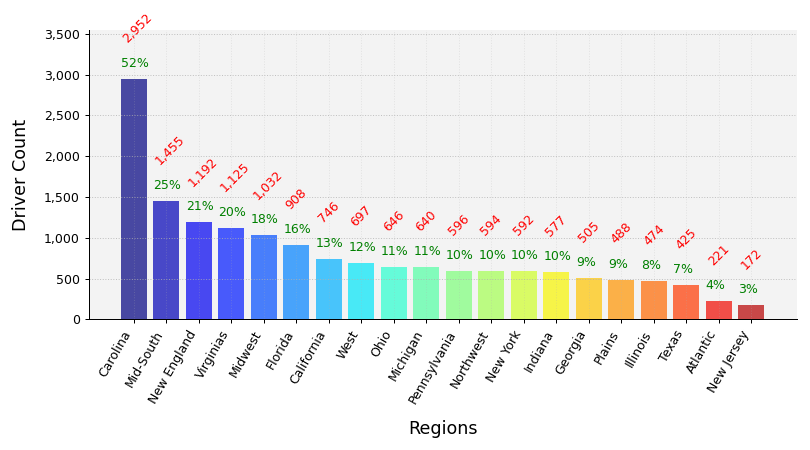
USA Clubs Distribution
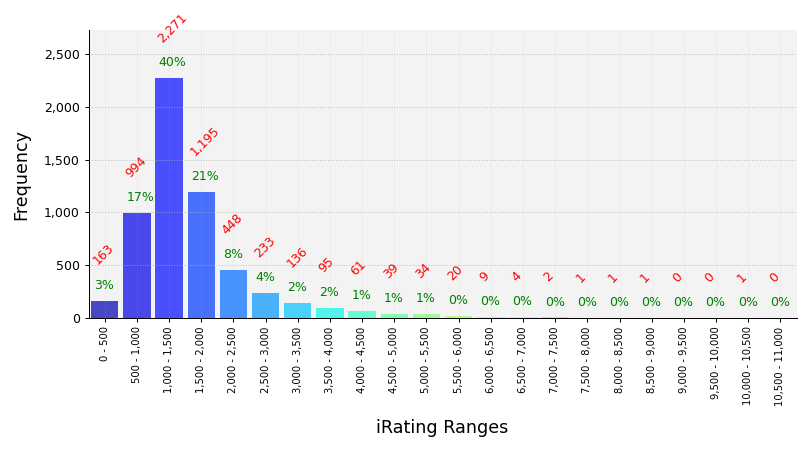
iRating Distribution
Championship Points
| # |
groupid |
Driver |
Points |
| 1 |
315887 |
River Hays |
1,424 |
| 2 |
532601 |
Kyle Myer |
1,132 |
| 3 |
494232 |
Brendan R Lee |
1,117 |
| 4 |
65367 |
Kyle Boudreau |
1,050 |
| 5 |
103668 |
Matthew Brinson |
996 |
Most Race Starts
| # |
groupid |
Driver |
Starts |
| 1 |
176451 |
Christopher Rives |
103 |
| 2 |
633609 |
Anthony Scott4 |
103 |
| 3 |
434300 |
William Scott8 |
96 |
| 4 |
523690 |
Todd Edwards3 |
72 |
| 5 |
633669 |
S. Andrew Brown |
70 |
Grand Chelems
pole position, won race, fastest lap, led every lap (perfect if 0 inc)
| # |
groupid |
Driver |
Grand Chelems |
Chelem % |
Perfects |
| 1 |
315887 |
River Hays |
21 |
54% |
19 |
| 2 |
216728 |
Joe Martinez Sr |
19 |
58% |
15 |
| 3 |
79074 |
Joel Blewitt |
17 |
94% |
17 |
| 4 |
494232 |
Brendan R Lee |
14 |
22% |
12 |
| 5 |
346152 |
Nicolas Pigneur |
12 |
29% |
10 |
Average Finish Position
drivers must have raced 8 or more weeks to feature in this table
| # |
groupid |
Driver |
Avg Finish Pos |
Races |
| 1 |
216728 |
Joe Martinez Sr |
1.4 |
26 |
| 2 |
315887 |
River Hays |
1.5 |
35 |
| 3 |
556531 |
Jaron Parks |
2.1 |
16 |
| 4 |
445292 |
Jimmy Faupl |
2.4 |
10 |
| 5 |
532601 |
Kyle Myer |
2.4 |
16 |
Most Wins
| # |
groupid |
Driver |
Wins |
| 1 |
315887 |
River Hays |
30 |
| 2 |
216728 |
Joe Martinez Sr |
23 |
| 3 |
346152 |
Nicolas Pigneur |
20 |
| 4 |
494232 |
Brendan R Lee |
19 |
| 5 |
79074 |
Joel Blewitt |
18 |
Most Podiums
| # |
groupid |
Driver |
Podiums |
| 1 |
494232 |
Brendan R Lee |
45 |
| 2 |
315887 |
River Hays |
34 |
| 3 |
523690 |
Todd Edwards3 |
32 |
| 4 |
346152 |
Nicolas Pigneur |
28 |
| 5 |
216728 |
Joe Martinez Sr |
25 |
Most Poles
| # |
groupid |
Driver |
Poles |
| 1 |
315887 |
River Hays |
29 |
| 2 |
494232 |
Brendan R Lee |
22 |
| 3 |
216728 |
Joe Martinez Sr |
21 |
| 4 |
79074 |
Joel Blewitt |
18 |
| 5 |
567634 |
Regan Ford |
13 |
Best Win Percentage
drivers must have raced 8 or more weeks to feature in this table
| # |
groupid |
Driver |
Win % |
Races |
| 1 |
216728 |
Joe Martinez Sr |
88% |
26 |
| 2 |
315887 |
River Hays |
86% |
35 |
| 3 |
556531 |
Jaron Parks |
56% |
16 |
| 4 |
532601 |
Kyle Myer |
50% |
16 |
| 5 |
590504 |
Audrey Eldridge |
48% |
31 |
Best Podium Percentage
drivers must have raced 8 or more weeks to feature in this table
| # |
groupid |
Driver |
Podium % |
Races |
| 1 |
315887 |
River Hays |
97% |
35 |
| 2 |
216728 |
Joe Martinez Sr |
96% |
26 |
| 3 |
379796 |
Kaileb Tremaine |
89% |
9 |
| 4 |
532601 |
Kyle Myer |
88% |
16 |
| 5 |
494232 |
Brendan R Lee |
82% |
55 |
Best Pole Percentage
drivers must have raced 8 or more weeks to feature in this table
| # |
groupid |
Driver |
Pole % |
Races |
| 1 |
315887 |
River Hays |
83% |
35 |
| 2 |
216728 |
Joe Martinez Sr |
81% |
26 |
| 3 |
532601 |
Kyle Myer |
62% |
16 |
| 4 |
556531 |
Jaron Parks |
50% |
16 |
| 5 |
521356 |
Paula Whittaker |
50% |
14 |
Best Average iRating Gains
drivers must have raced 8 or more weeks to feature in this table
| # |
groupid |
Team |
Avg iRating +/- |
Races |
| 1 |
556531 |
Jaron Parks |
68 |
16 |
| 2 |
609852 |
Craig Mariani |
47 |
17 |
| 3 |
481100 |
Johnie Collier |
41 |
16 |
| 4 |
580768 |
Scott Huntington |
37 |
20 |
| 5 |
601264 |
Andi Wildauer |
37 |
16 |
Highest Total iRating Gains
| # |
groupid |
Team |
iRating +/- |
Races |
| 1 |
494232 |
Brendan R Lee |
1,749 |
55 |
| 2 |
523690 |
Todd Edwards3 |
1,142 |
72 |
| 3 |
346152 |
Nicolas Pigneur |
1,115 |
35 |
| 4 |
556531 |
Jaron Parks |
1,081 |
16 |
| 5 |
567634 |
Regan Ford |
1,049 |
31 |
Cleanest Drivers
drivers must have raced 8 or more weeks to feature in this table
| # |
groupid |
Driver |
Inc / Corner |
| 1 |
315887 |
River Hays |
0.001 |
| 2 |
266754 |
Danford Bynum |
0.002 |
| 3 |
532601 |
Kyle Myer |
0.002 |
| 4 |
468751 |
Josh Burford |
0.004 |
| 5 |
206772 |
Jake Holley |
0.005 |