NASCAR Tour Modified Series - Fixed
2021 Season 3
- 2,935 unique drivers averaging 2.81 starts each.
- 64 drivers raced in 8 or more weeks.
- 635 official races with an average SOF of 1,719.
- 335,867 laps were completed with 48,349 incidents.
- Total official races: 35
- Total drivers: 236
- Unique drivers: 193
- Highest SoF: 3,021
- Average SoF: 1,828
| # |
groupid |
Driver |
Points |
| 1 |
284230 |
Carter Russo |
149 |
| 2 |
421234 |
Ty LeClerc |
135 |
| 3 |
448467 |
Rick spencer-walt |
125 |
Week 2
Martinsville Speedway
- Total official races: 69
- Total drivers: 857
- Unique drivers: 554
- Highest SoF: 3,381
- Average SoF: 1,927
| # |
groupid |
Driver |
Points |
| 1 |
76634 |
Greg Ostrander |
179 |
| 2 |
110893 |
Kyle B Scisco |
157 |
| 3 |
111754 |
James Stanger |
154 |
Week 3
Southern National Motorsports Park
- Total official races: 69
- Total drivers: 827
- Unique drivers: 563
- Highest SoF: 2,830
- Average SoF: 1,722
| # |
groupid |
Driver |
Points |
| 1 |
588536 |
Weston Ward |
150 |
| 2 |
74951 |
Billy Bigley Jr |
149 |
| 3 |
485362 |
Keaton Tripp |
147 |
Week 4
Thompson Speedway Motorsports Park
Oval
- Total official races: 72
- Total drivers: 825
- Unique drivers: 562
- Highest SoF: 3,570
- Average SoF: 1,772
| # |
groupid |
Driver |
Points |
| 1 |
75290 |
Ryan Lutz |
181 |
| 2 |
319856 |
Anthony Buzzella |
162 |
| 3 |
120044 |
Corey Rogers |
158 |
Week 5
New Hampshire Motor Speedway
Oval
- Total official races: 66
- Total drivers: 786
- Unique drivers: 481
- Highest SoF: 3,795
- Average SoF: 1,889
| # |
groupid |
Driver |
Points |
| 1 |
171664 |
Thomas Axsom |
187 |
| 2 |
54614 |
Bryan Narducci |
161 |
| 3 |
353953 |
Jared Audette |
158 |
Week 6
South Boston Speedway
- Total official races: 70
- Total drivers: 742
- Unique drivers: 507
- Highest SoF: 3,093
- Average SoF: 1,697
| # |
groupid |
Driver |
Points |
| 1 |
75290 |
Ryan Lutz |
170 |
| 2 |
54614 |
Bryan Narducci |
158 |
| 3 |
538598 |
Blake Giglio |
155 |
Week 7
Lanier National Speedway
Asphalt
- Total official races: 72
- Total drivers: 813
- Unique drivers: 512
- Highest SoF: 3,604
- Average SoF: 1,788
| # |
groupid |
Driver |
Points |
| 1 |
171664 |
Thomas Axsom |
178 |
| 2 |
222356 |
Jean-Philippe Bergeron |
177 |
| 3 |
75290 |
Ryan Lutz |
162 |
Week 8
Stafford Motor Speedway
Full Course
- Total official races: 61
- Total drivers: 551
- Unique drivers: 348
- Highest SoF: 3,912
- Average SoF: 1,855
| # |
groupid |
Driver |
Points |
| 1 |
79897 |
Mike Christopher Jr |
198 |
| 2 |
314277 |
Marcus Fruchtenicht |
187 |
| 3 |
37635 |
Cory DiMatteo |
184 |
Week 9
USA International Speedway
Asphalt
- Total official races: 83
- Total drivers: 856
- Unique drivers: 566
- Highest SoF: 2,988
- Average SoF: 1,494
| # |
groupid |
Driver |
Points |
| 1 |
415248 |
Ray Fattaruso |
159 |
| 2 |
258008 |
Leonard Harrison III |
158 |
| 3 |
491940 |
Jacob Bombard |
151 |
Week 10
Five Flags Speedway
- Total official races: 58
- Total drivers: 544
- Unique drivers: 357
- Highest SoF: 3,119
- Average SoF: 1,623
| # |
groupid |
Driver |
Points |
| 1 |
54614 |
Bryan Narducci |
165 |
| 2 |
473549 |
Dennis Wilder Jr |
155 |
| 3 |
504538 |
Luke G Baldwin |
153 |
Week 11
Nashville Fairgrounds Speedway
Oval
- Total official races: 55
- Total drivers: 473
- Unique drivers: 332
- Highest SoF: 2,575
- Average SoF: 1,676
| # |
groupid |
Driver |
Points |
| 1 |
120044 |
Corey Rogers |
139 |
| 2 |
504538 |
Luke G Baldwin |
138 |
| 3 |
50468 |
Ryan Libby |
136 |
- Total official races: 75
- Total drivers: 749
- Unique drivers: 502
- Highest SoF: 2,428
- Average SoF: 1,471
| # |
groupid |
Driver |
Points |
| 1 |
314277 |
Marcus Fruchtenicht |
142 |
| 2 |
591623 |
Kelly Miller2 |
141 |
| 3 |
350862 |
Vincent Isabella |
138 |
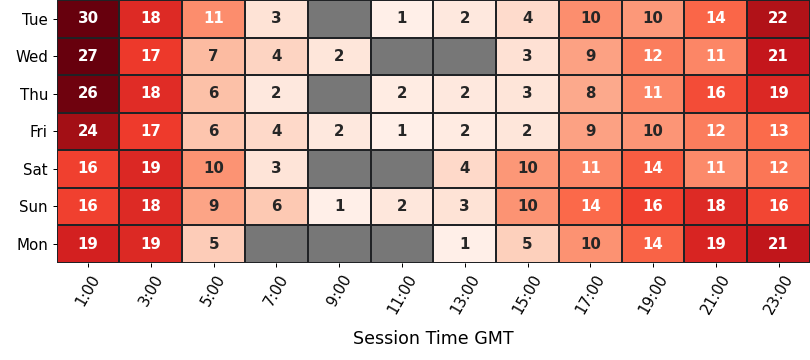
Participation
average number of drivers in each time slot
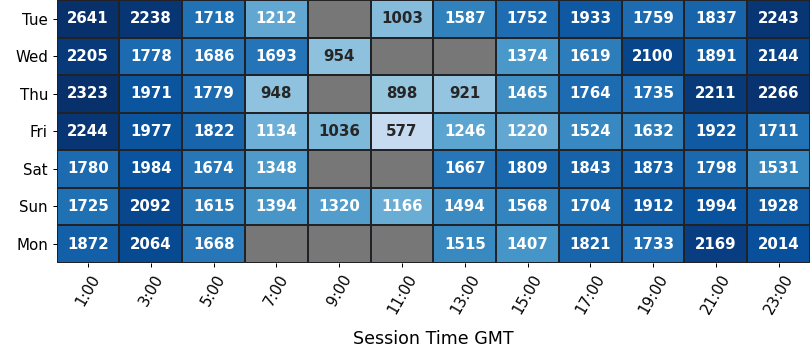
Strength of Field
average SoF of the top split for each time slot
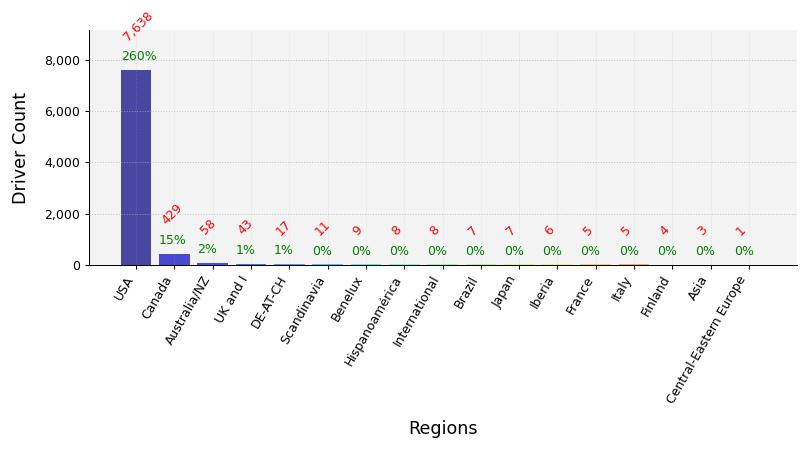
Clubs Distribution
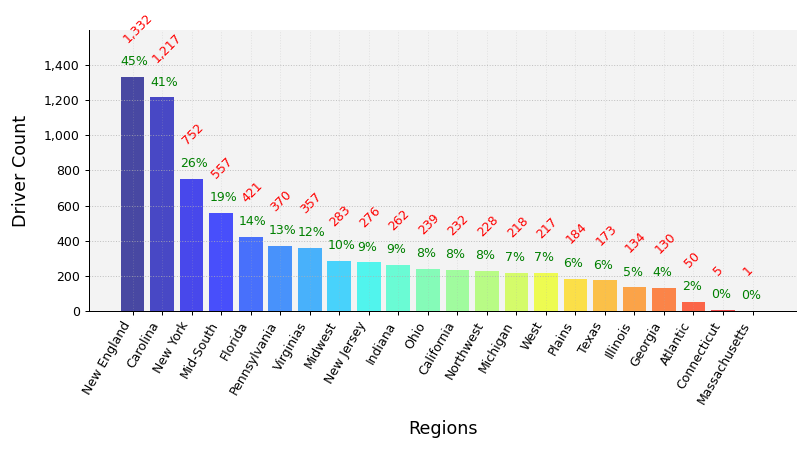
USA Clubs Distribution
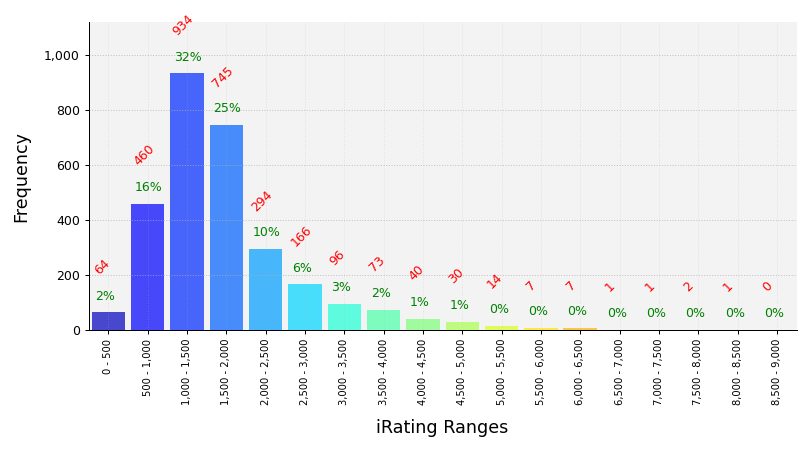
iRating Distribution
Championship Points
| # |
groupid |
Driver |
Points |
| 1 |
54614 |
Bryan Narducci |
1,172 |
| 2 |
504538 |
Luke G Baldwin |
1,063 |
| 3 |
485362 |
Keaton Tripp |
1,022 |
| 4 |
582017 |
Mitch Drewnowski |
996 |
| 5 |
79897 |
Mike Christopher Jr |
973 |
Most Race Starts
| # |
groupid |
Driver |
Starts |
| 1 |
504538 |
Luke G Baldwin |
75 |
| 2 |
541885 |
Tracy Pedder |
67 |
| 3 |
609538 |
Dylan Buske |
65 |
| 4 |
585836 |
Alexander Cyr3 |
61 |
| 5 |
582017 |
Mitch Drewnowski |
57 |
Grand Chelems
pole position, won race, fastest lap, led every lap (perfect if 0 inc)
| # |
groupid |
Driver |
Grand Chelems |
Chelem % |
Perfects |
| 1 |
582017 |
Mitch Drewnowski |
16 |
25% |
14 |
| 2 |
504538 |
Luke G Baldwin |
8 |
4% |
3 |
| 3 |
485362 |
Keaton Tripp |
7 |
9% |
3 |
| 4 |
585836 |
Alexander Cyr3 |
7 |
3% |
2 |
| 5 |
588536 |
Weston Ward |
6 |
14% |
4 |
Average Finish Position
drivers must have raced 8 or more weeks to feature in this table
| # |
groupid |
Driver |
Avg Finish Pos |
Races |
| 1 |
582017 |
Mitch Drewnowski |
3.1 |
57 |
| 2 |
314377 |
Christopher Monroe |
3.1 |
18 |
| 3 |
54614 |
Bryan Narducci |
3.6 |
43 |
| 4 |
413527 |
Daniel R Hall |
3.9 |
8 |
| 5 |
485362 |
Keaton Tripp |
4.0 |
34 |
Most Wins
| # |
groupid |
Driver |
Wins |
| 1 |
582017 |
Mitch Drewnowski |
28 |
| 2 |
504538 |
Luke G Baldwin |
25 |
| 3 |
585836 |
Alexander Cyr3 |
18 |
| 4 |
485362 |
Keaton Tripp |
17 |
| 5 |
446591 |
Jonathan Tuckness |
14 |
Most Podiums
| # |
groupid |
Driver |
Podiums |
| 1 |
504538 |
Luke G Baldwin |
50 |
| 2 |
582017 |
Mitch Drewnowski |
44 |
| 3 |
353953 |
Jared Audette |
32 |
| 4 |
609538 |
Dylan Buske |
31 |
| 5 |
585836 |
Alexander Cyr3 |
31 |
Most Poles
| # |
groupid |
Driver |
Poles |
| 1 |
582017 |
Mitch Drewnowski |
34 |
| 2 |
504538 |
Luke G Baldwin |
18 |
| 3 |
585836 |
Alexander Cyr3 |
13 |
| 4 |
541885 |
Tracy Pedder |
12 |
| 5 |
446591 |
Jonathan Tuckness |
12 |
Best Win Percentage
drivers must have raced 8 or more weeks to feature in this table
| # |
groupid |
Driver |
Win % |
Races |
| 1 |
485362 |
Keaton Tripp |
50% |
34 |
| 2 |
582017 |
Mitch Drewnowski |
49% |
57 |
| 3 |
588536 |
Weston Ward |
48% |
29 |
| 4 |
415248 |
Ray Fattaruso |
48% |
21 |
| 5 |
446591 |
Jonathan Tuckness |
41% |
34 |
Best Podium Percentage
drivers must have raced 8 or more weeks to feature in this table
| # |
groupid |
Driver |
Podium % |
Races |
| 1 |
582017 |
Mitch Drewnowski |
77% |
57 |
| 2 |
54614 |
Bryan Narducci |
70% |
43 |
| 3 |
504538 |
Luke G Baldwin |
67% |
75 |
| 4 |
485362 |
Keaton Tripp |
65% |
34 |
| 5 |
265931 |
Matt McGrath |
64% |
11 |
Best Pole Percentage
drivers must have raced 8 or more weeks to feature in this table
| # |
groupid |
Driver |
Pole % |
Races |
| 1 |
110893 |
Kyle B Scisco |
69% |
16 |
| 2 |
582017 |
Mitch Drewnowski |
60% |
57 |
| 3 |
415248 |
Ray Fattaruso |
48% |
21 |
| 4 |
588536 |
Weston Ward |
38% |
29 |
| 5 |
485362 |
Keaton Tripp |
35% |
34 |
Best Average iRating Gains
drivers must have raced 8 or more weeks to feature in this table
| # |
groupid |
Team |
Avg iRating +/- |
Races |
| 1 |
525052 |
Ryan Grassie |
28 |
18 |
| 2 |
517746 |
Rick Kelley |
27 |
27 |
| 3 |
16374 |
Matthew Benjamin |
24 |
9 |
| 4 |
585836 |
Alexander Cyr3 |
23 |
61 |
| 5 |
598008 |
Shawn Carmody2 |
21 |
10 |
Highest Total iRating Gains
| # |
groupid |
Team |
iRating +/- |
Races |
| 1 |
609538 |
Dylan Buske |
1,436 |
65 |
| 2 |
585836 |
Alexander Cyr3 |
1,396 |
61 |
| 3 |
504538 |
Luke G Baldwin |
1,288 |
75 |
| 4 |
335931 |
Greg Freeman |
800 |
22 |
| 5 |
517746 |
Rick Kelley |
736 |
27 |
Cleanest Drivers
drivers must have raced 8 or more weeks to feature in this table
| # |
groupid |
Driver |
Inc / Corner |
| 1 |
314377 |
Christopher Monroe |
0.011 |
| 2 |
644323 |
Bill Muhlfeld |
0.013 |
| 3 |
518749 |
Brian Darbe |
0.014 |
| 4 |
617443 |
Justin Odle |
0.016 |
| 5 |
582017 |
Mitch Drewnowski |
0.017 |