World of Outlaws Late Model Series - Fixed
2021 Season 3
- 3,382 unique drivers averaging 3.71 starts each.
- 102 drivers raced in 8 or more weeks.
- 1,011 official races with an average SOF of 2,051.
- 306,685 laps were completed with 34,422 incidents.
Week 1
The Dirt Track at Charlotte
- Total official races: 127
- Total drivers: 1,537
- Unique drivers: 875
- Highest SoF: 4,018
- Average SoF: 2,035
| # |
groupid |
Driver |
Points |
| 1 |
260356 |
Steven Wilson3 |
222 |
| 2 |
61016 |
Cole Exum |
207 |
| 3 |
374481 |
Brent D Carter |
200 |
Week 2
Weedsport Speedway
- Total official races: 69
- Total drivers: 582
- Unique drivers: 397
- Highest SoF: 4,241
- Average SoF: 2,208
| # |
groupid |
Driver |
Points |
| 1 |
295661 |
Christopher McGuire |
199 |
| 2 |
349924 |
Matt S Sanders |
176 |
| 3 |
458327 |
Daniel J Adam |
174 |
- Total official races: 134
- Total drivers: 1,697
- Unique drivers: 951
- Highest SoF: 3,689
- Average SoF: 2,004
| # |
groupid |
Driver |
Points |
| 1 |
172417 |
Jay Place |
200 |
| 2 |
260356 |
Steven Wilson3 |
190 |
| 3 |
541993 |
Mike Augustine |
189 |
Week 4
Lanier National Speedway
Dirt
- Total official races: 128
- Total drivers: 1,385
- Unique drivers: 819
- Highest SoF: 4,032
- Average SoF: 2,062
| # |
groupid |
Driver |
Points |
| 1 |
343977 |
Dylan Yeager |
209 |
| 2 |
172417 |
Jay Place |
199 |
| 3 |
339010 |
Jamie Massey |
194 |
- Total official races: 139
- Total drivers: 1,742
- Unique drivers: 887
- Highest SoF: 4,150
- Average SoF: 2,057
| # |
groupid |
Driver |
Points |
| 1 |
276786 |
Zane Yost |
208 |
| 2 |
281243 |
Keith Hackney |
203 |
| 3 |
295661 |
Christopher McGuire |
198 |
- Total official races: 65
- Total drivers: 578
- Unique drivers: 418
- Highest SoF: 3,904
- Average SoF: 2,177
| # |
groupid |
Driver |
Points |
| 1 |
422059 |
Payton Talbot |
195 |
| 2 |
298479 |
Jordan Millard |
178 |
| 3 |
281243 |
Keith Hackney |
170 |
- Total official races: 61
- Total drivers: 472
- Unique drivers: 345
- Highest SoF: 3,991
- Average SoF: 2,266
| # |
groupid |
Driver |
Points |
| 1 |
273138 |
Nathan R Waddell |
197 |
| 2 |
266176 |
Cole Ashcraft |
175 |
| 3 |
343977 |
Dylan Yeager |
172 |
Week 8
Lernerville Speedway
- Total official races: 91
- Total drivers: 930
- Unique drivers: 567
- Highest SoF: 3,998
- Average SoF: 2,001
| # |
groupid |
Driver |
Points |
| 1 |
246298 |
Alex A Bergeron |
204 |
| 2 |
273138 |
Nathan R Waddell |
191 |
| 3 |
404799 |
Steven Gilbert4 |
189 |
Week 9
Cedar Lake Speedway
- Total official races: 97
- Total drivers: 944
- Unique drivers: 580
- Highest SoF: 3,478
- Average SoF: 1,984
| # |
groupid |
Driver |
Points |
| 1 |
369202 |
Huey Quillen |
196 |
| 2 |
497341 |
Félix Roy2 |
196 |
| 3 |
339010 |
Jamie Massey |
186 |
Week 10
Limaland Motorsports Park
- Total official races: 99
- Total drivers: 994
- Unique drivers: 639
- Highest SoF: 4,925
- Average SoF: 1,983
| # |
groupid |
Driver |
Points |
| 1 |
281243 |
Keith Hackney |
265 |
| 2 |
246088 |
Hunter Carroll |
224 |
| 3 |
343977 |
Dylan Yeager |
211 |
Week 11
Williams Grove Speedway
- Total official races: 68
- Total drivers: 403
- Unique drivers: 293
- Highest SoF: 3,917
- Average SoF: 1,988
| # |
groupid |
Driver |
Points |
| 1 |
333276 |
AJ Crews |
185 |
| 2 |
295661 |
Christopher McGuire |
185 |
| 3 |
273201 |
Tyler Burrow |
184 |
Week 12
Volusia Speedway Park
- Total official races: 113
- Total drivers: 1,269
- Unique drivers: 730
- Highest SoF: 4,186
- Average SoF: 2,012
| # |
groupid |
Driver |
Points |
| 1 |
295661 |
Christopher McGuire |
229 |
| 2 |
270582 |
Jarrett Murphy |
209 |
| 3 |
635278 |
Logan Rumsey2 |
198 |
Historical Participation
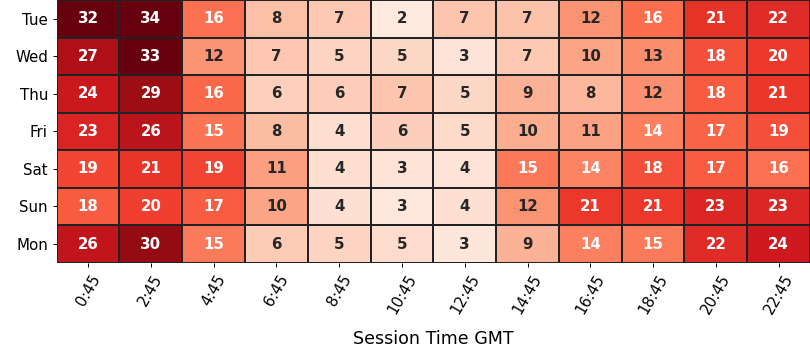
Participation
average number of drivers in each time slot
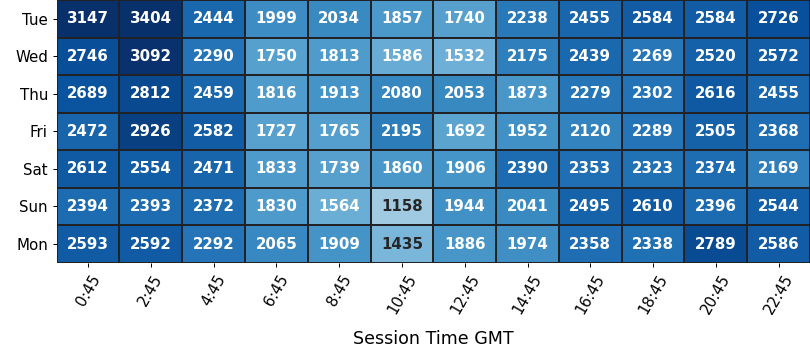
Strength of Field
average SoF of the top split for each time slot
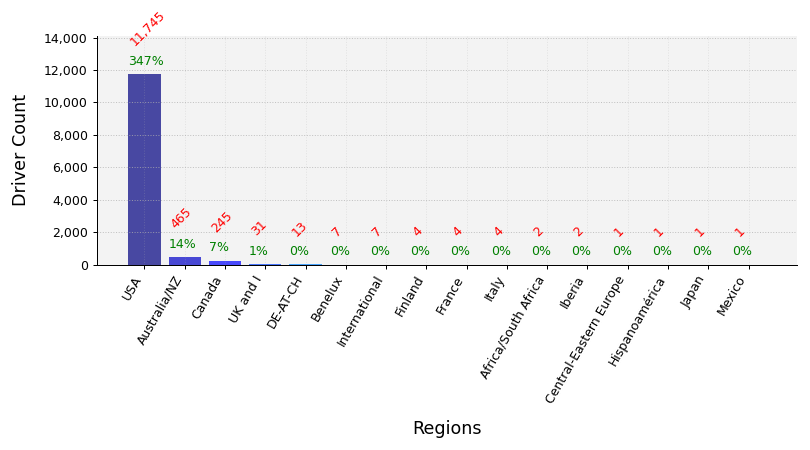
Clubs Distribution
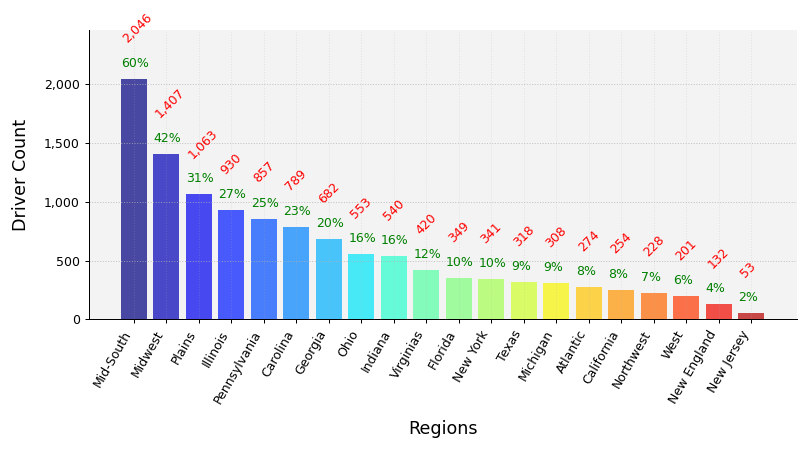
USA Clubs Distribution
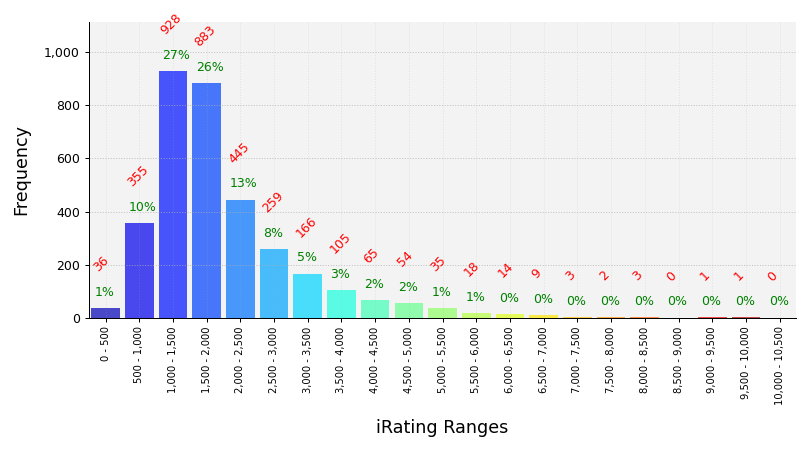
iRating Distribution
Championship Points
| # |
groupid |
Driver |
Points |
| 1 |
295661 |
Christopher McGuire |
1,528 |
| 2 |
281243 |
Keith Hackney |
1,501 |
| 3 |
273138 |
Nathan R Waddell |
1,405 |
| 4 |
519264 |
Blake M Andrews |
1,322 |
| 5 |
517428 |
Austin Hunter7 |
1,236 |
Most Race Starts
| # |
groupid |
Driver |
Starts |
| 1 |
515448 |
Ken Brown |
113 |
| 2 |
367900 |
Nathan Culpepper |
85 |
| 3 |
374091 |
Chris R Fields |
70 |
| 4 |
513786 |
Joshua Godinez |
67 |
| 5 |
444617 |
Eric Roberts5 |
62 |
Grand Chelems
pole position, won race, fastest lap, led every lap (perfect if 0 inc)
| # |
groupid |
Driver |
Grand Chelems |
Chelem % |
Perfects |
| 1 |
281243 |
Keith Hackney |
19 |
50% |
18 |
| 2 |
295661 |
Christopher McGuire |
13 |
39% |
11 |
| 3 |
367900 |
Nathan Culpepper |
13 |
12% |
10 |
| 4 |
559250 |
Chris Peters3 |
9 |
14% |
8 |
| 5 |
269643 |
Jesse Enterkin |
6 |
40% |
4 |
Average Finish Position
drivers must have raced 8 or more weeks to feature in this table
| # |
groupid |
Driver |
Avg Finish Pos |
Races |
| 1 |
295661 |
Christopher McGuire |
1.3 |
28 |
| 2 |
270384 |
Shane James3 |
1.5 |
11 |
| 3 |
281243 |
Keith Hackney |
1.8 |
36 |
| 4 |
273138 |
Nathan R Waddell |
2.3 |
19 |
| 5 |
519264 |
Blake M Andrews |
2.4 |
17 |
Most Wins
| # |
groupid |
Driver |
Wins |
| 1 |
281243 |
Keith Hackney |
27 |
| 2 |
295661 |
Christopher McGuire |
25 |
| 3 |
367900 |
Nathan Culpepper |
24 |
| 4 |
559250 |
Chris Peters3 |
21 |
| 5 |
444617 |
Eric Roberts5 |
13 |
Most Podiums
| # |
groupid |
Driver |
Podiums |
| 1 |
367900 |
Nathan Culpepper |
60 |
| 2 |
559250 |
Chris Peters3 |
44 |
| 3 |
281243 |
Keith Hackney |
32 |
| 4 |
444617 |
Eric Roberts5 |
28 |
| 5 |
295661 |
Christopher McGuire |
27 |
Most Poles
| # |
groupid |
Driver |
Poles |
| 1 |
367900 |
Nathan Culpepper |
30 |
| 2 |
281243 |
Keith Hackney |
27 |
| 3 |
295661 |
Christopher McGuire |
19 |
| 4 |
374091 |
Chris R Fields |
18 |
| 5 |
559250 |
Chris Peters3 |
17 |
Best Win Percentage
drivers must have raced 8 or more weeks to feature in this table
| # |
groupid |
Driver |
Win % |
Races |
| 1 |
295661 |
Christopher McGuire |
89% |
28 |
| 2 |
281243 |
Keith Hackney |
75% |
36 |
| 3 |
270384 |
Shane James3 |
73% |
11 |
| 4 |
273138 |
Nathan R Waddell |
53% |
19 |
| 5 |
517428 |
Austin Hunter7 |
44% |
16 |
Best Podium Percentage
drivers must have raced 8 or more weeks to feature in this table
| # |
groupid |
Driver |
Podium % |
Races |
| 1 |
270384 |
Shane James3 |
100% |
11 |
| 2 |
295661 |
Christopher McGuire |
96% |
28 |
| 3 |
281243 |
Keith Hackney |
89% |
36 |
| 4 |
273138 |
Nathan R Waddell |
89% |
19 |
| 5 |
519264 |
Blake M Andrews |
82% |
17 |
Best Pole Percentage
drivers must have raced 8 or more weeks to feature in this table
| # |
groupid |
Driver |
Pole % |
Races |
| 1 |
281243 |
Keith Hackney |
75% |
36 |
| 2 |
270384 |
Shane James3 |
73% |
11 |
| 3 |
295661 |
Christopher McGuire |
68% |
28 |
| 4 |
273138 |
Nathan R Waddell |
63% |
19 |
| 5 |
556531 |
Jaron Parks |
40% |
15 |
Best Average iRating Gains
drivers must have raced 8 or more weeks to feature in this table
| # |
groupid |
Team |
Avg iRating +/- |
Races |
| 1 |
588384 |
Cody McElreath |
54 |
19 |
| 2 |
424701 |
Jayden Johnson2 |
46 |
11 |
| 3 |
423436 |
Donald Turbeville |
41 |
18 |
| 4 |
519264 |
Blake M Andrews |
38 |
17 |
| 5 |
556531 |
Jaron Parks |
37 |
15 |
Highest Total iRating Gains
| # |
groupid |
Team |
iRating +/- |
Races |
| 1 |
367900 |
Nathan Culpepper |
1,571 |
85 |
| 2 |
559250 |
Chris Peters3 |
1,460 |
58 |
| 3 |
374091 |
Chris R Fields |
1,160 |
70 |
| 4 |
366041 |
Jake Silvia |
1,043 |
45 |
| 5 |
509629 |
Jeremy Stonicher |
1,029 |
30 |
Cleanest Drivers
drivers must have raced 8 or more weeks to feature in this table
| # |
groupid |
Driver |
Inc / Corner |
| 1 |
519264 |
Blake M Andrews |
0.000 |
| 2 |
270384 |
Shane James3 |
0.002 |
| 3 |
281243 |
Keith Hackney |
0.004 |
| 4 |
273138 |
Nathan R Waddell |
0.004 |
| 5 |
373244 |
robert PRICE2 |
0.006 |