Advanced Legends VRS Cup
2021 Season 4
- 13,987 unique drivers averaging 5.38 starts each.
- 451 drivers raced in 8 or more weeks.
- 6,265 official races with an average SOF of 1,445.
- 2,379,698 laps were completed with 348,126 incidents.
Week 1
[Legacy] Charlotte Motor Speedway - 2008
Legends Oval
- Total official races: 289
- Total drivers: 3,150
- Unique drivers: 1,595
- Highest SoF: 4,844
- Average SoF: 1,474
| # |
groupid |
Driver |
Points |
| 1 |
178325 |
Ryan J Kuhn |
254 |
| 2 |
374558 |
Joel M Smith |
230 |
| 3 |
60050 |
David Polenz |
207 |
Week 2
USA International Speedway
Asphalt
- Total official races: 551
- Total drivers: 14,798
- Unique drivers: 4,711
- Highest SoF: 3,974
- Average SoF: 1,407
| # |
groupid |
Driver |
Points |
| 1 |
178325 |
Ryan J Kuhn |
220 |
| 2 |
75290 |
Ryan Lutz |
208 |
| 3 |
532601 |
Kyle Myer |
201 |
Week 3
Oxford Plains Speedway
- Total official races: 417
- Total drivers: 11,482
- Unique drivers: 3,962
- Highest SoF: 4,363
- Average SoF: 1,483
| # |
groupid |
Driver |
Points |
| 1 |
178325 |
Ryan J Kuhn |
237 |
| 2 |
394188 |
Cody M. Vreeland |
217 |
| 3 |
193113 |
Daniel Folds |
197 |
- Total official races: 483
- Total drivers: 5,758
- Unique drivers: 2,106
- Highest SoF: 4,590
- Average SoF: 1,450
| # |
groupid |
Driver |
Points |
| 1 |
178325 |
Ryan J Kuhn |
250 |
| 2 |
50626 |
Cullen Roberts |
230 |
| 3 |
394188 |
Cody M. Vreeland |
190 |
Week 5
South Boston Speedway
- Total official races: 583
- Total drivers: 6,993
- Unique drivers: 2,602
- Highest SoF: 4,857
- Average SoF: 1,416
| # |
groupid |
Driver |
Points |
| 1 |
193113 |
Daniel Folds |
258 |
| 2 |
178325 |
Ryan J Kuhn |
228 |
| 3 |
394188 |
Cody M. Vreeland |
195 |
Week 6
Southern National Motorsports Park
- Total official races: 619
- Total drivers: 7,574
- Unique drivers: 2,471
- Highest SoF: 4,643
- Average SoF: 1,421
| # |
groupid |
Driver |
Points |
| 1 |
178325 |
Ryan J Kuhn |
249 |
| 2 |
465047 |
Patrick Day |
207 |
| 3 |
193113 |
Daniel Folds |
202 |
Week 7
Charlotte Motor Speedway
Legends Oval - 2018
- Total official races: 283
- Total drivers: 3,067
- Unique drivers: 1,622
- Highest SoF: 4,259
- Average SoF: 1,449
| # |
groupid |
Driver |
Points |
| 1 |
178325 |
Ryan J Kuhn |
233 |
| 2 |
193113 |
Daniel Folds |
213 |
| 3 |
98595 |
James Folds |
194 |
Week 8
Thompson Speedway Motorsports Park
Oval
- Total official races: 546
- Total drivers: 6,627
- Unique drivers: 2,392
- Highest SoF: 5,029
- Average SoF: 1,389
| # |
groupid |
Driver |
Points |
| 1 |
178325 |
Ryan J Kuhn |
269 |
| 2 |
193113 |
Daniel Folds |
197 |
| 3 |
214784 |
Tyler Cox |
186 |
- Total official races: 613
- Total drivers: 7,539
- Unique drivers: 2,514
- Highest SoF: 4,248
- Average SoF: 1,457
| # |
groupid |
Driver |
Points |
| 1 |
178325 |
Ryan J Kuhn |
235 |
| 2 |
193113 |
Daniel Folds |
203 |
| 3 |
214784 |
Tyler Cox |
198 |
Week 10
Lanier National Speedway
Asphalt
- Total official races: 668
- Total drivers: 8,309
- Unique drivers: 2,693
- Highest SoF: 4,541
- Average SoF: 1,463
| # |
groupid |
Driver |
Points |
| 1 |
193113 |
Daniel Folds |
245 |
| 2 |
50626 |
Cullen Roberts |
224 |
| 3 |
374558 |
Joel M Smith |
212 |
Week 11
Oxford Plains Speedway
- Total official races: 548
- Total drivers: 11,482
- Unique drivers: 3,962
- Highest SoF: 4,623
- Average SoF: 1,513
| # |
groupid |
Driver |
Points |
| 1 |
178325 |
Ryan J Kuhn |
232 |
| 2 |
75290 |
Ryan Lutz |
203 |
| 3 |
107777 |
Ryan Kuhn |
203 |
Week 12
USA International Speedway
Asphalt
- Total official races: 665
- Total drivers: 14,798
- Unique drivers: 4,711
- Highest SoF: 4,982
- Average SoF: 1,446
| # |
groupid |
Driver |
Points |
| 1 |
214784 |
Tyler Cox |
267 |
| 2 |
178325 |
Ryan J Kuhn |
246 |
| 3 |
540977 |
Rick English |
225 |
Historical Participation
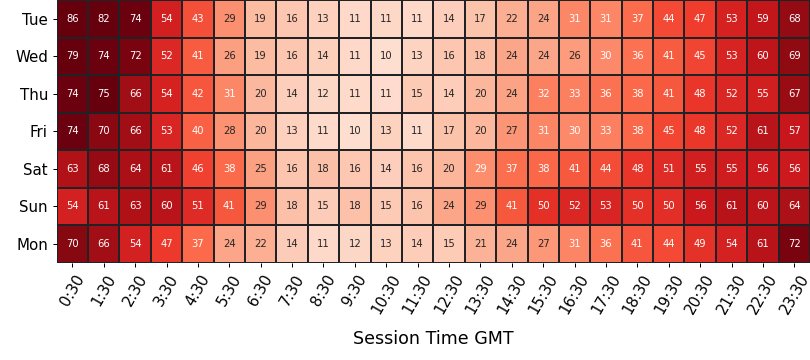
Participation
average number of drivers in each time slot
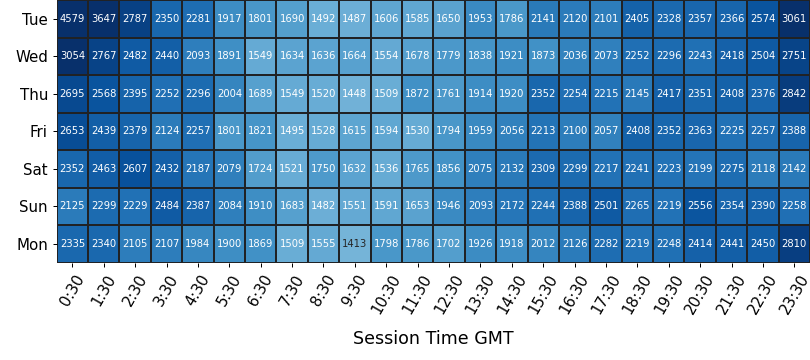
Strength of Field
average SoF of the top split for each time slot
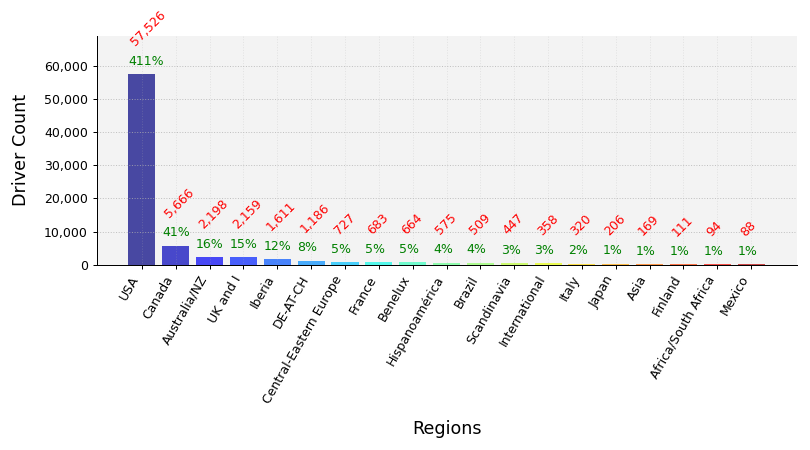
Clubs Distribution
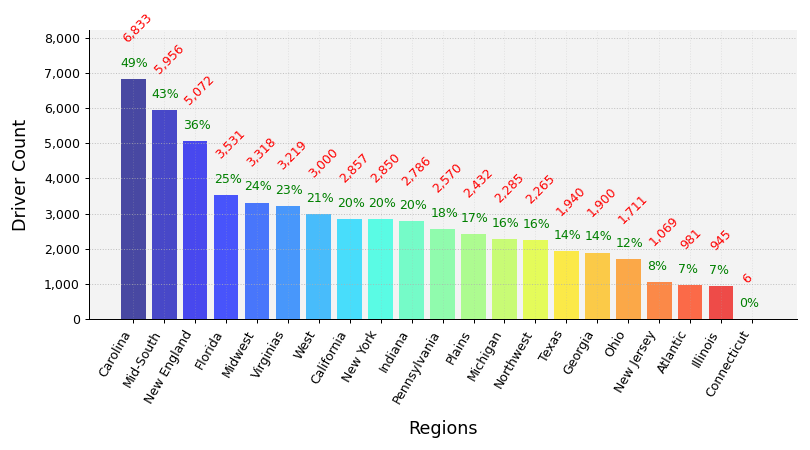
USA Clubs Distribution
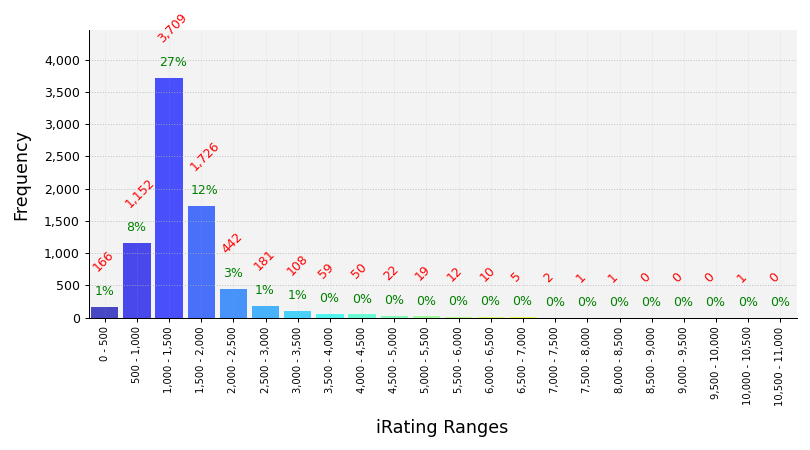
iRating Distribution
Championship Points
| # |
groupid |
Driver |
Points |
| 1 |
178325 |
Ryan J Kuhn |
1,973 |
| 2 |
193113 |
Daniel Folds |
1,712 |
| 3 |
75290 |
Ryan Lutz |
1,469 |
| 4 |
374558 |
Joel M Smith |
1,469 |
| 5 |
394188 |
Cody M. Vreeland |
1,461 |
Most Race Starts
| # |
groupid |
Driver |
Starts |
| 1 |
490036 |
Howard Bentley |
477 |
| 2 |
602763 |
Benjamin Richards |
373 |
| 3 |
426444 |
Stephen Leicht |
312 |
| 4 |
611104 |
Christopher Burling |
289 |
| 5 |
556648 |
Tom Scully |
261 |
Grand Chelems
pole position, won race, fastest lap, led every lap (perfect if 0 inc)
| # |
groupid |
Driver |
Grand Chelems |
Chelem % |
Perfects |
| 1 |
279357 |
Austin Hawkins |
71 |
39% |
68 |
| 2 |
107777 |
Ryan Kuhn |
51 |
89% |
43 |
| 3 |
374558 |
Joel M Smith |
28 |
33% |
15 |
| 4 |
678259 |
Joel L Blewitt |
27 |
51% |
21 |
| 5 |
590877 |
Mark Blessing |
25 |
33% |
22 |
Average Finish Position
drivers must have raced 8 or more weeks to feature in this table
| # |
groupid |
Driver |
Avg Finish Pos |
Races |
| 1 |
107777 |
Ryan Kuhn |
1.0 |
57 |
| 2 |
109076 |
Matt Kocher |
1.9 |
37 |
| 3 |
178325 |
Ryan J Kuhn |
2.0 |
28 |
| 4 |
214784 |
Tyler Cox |
2.1 |
56 |
| 5 |
279896 |
Ryan Bille |
2.4 |
36 |
Most Wins
| # |
groupid |
Driver |
Wins |
| 1 |
279357 |
Austin Hawkins |
133 |
| 2 |
54614 |
Bryan Narducci |
71 |
| 3 |
30828 |
Brian Guedesse3 |
62 |
| 4 |
446591 |
Jonathan Tuckness |
61 |
| 5 |
107777 |
Ryan Kuhn |
57 |
Most Podiums
| # |
groupid |
Driver |
Podiums |
| 1 |
54614 |
Bryan Narducci |
178 |
| 2 |
279357 |
Austin Hawkins |
171 |
| 3 |
446591 |
Jonathan Tuckness |
127 |
| 4 |
556648 |
Tom Scully |
124 |
| 5 |
602763 |
Benjamin Richards |
102 |
Most Poles
| # |
groupid |
Driver |
Poles |
| 1 |
279357 |
Austin Hawkins |
129 |
| 2 |
446591 |
Jonathan Tuckness |
66 |
| 3 |
107777 |
Ryan Kuhn |
56 |
| 4 |
649506 |
Jeff Gerstenlauer |
48 |
| 5 |
648160 |
James Slike |
48 |
Best Win Percentage
drivers must have raced 8 or more weeks to feature in this table
| # |
groupid |
Driver |
Win % |
Races |
| 1 |
107777 |
Ryan Kuhn |
100% |
57 |
| 2 |
178325 |
Ryan J Kuhn |
75% |
28 |
| 3 |
109076 |
Matt Kocher |
70% |
37 |
| 4 |
214784 |
Tyler Cox |
68% |
56 |
| 5 |
374558 |
Joel M Smith |
55% |
85 |
Best Podium Percentage
drivers must have raced 8 or more weeks to feature in this table
| # |
groupid |
Driver |
Podium % |
Races |
| 1 |
107777 |
Ryan Kuhn |
100% |
57 |
| 2 |
178325 |
Ryan J Kuhn |
89% |
28 |
| 3 |
214784 |
Tyler Cox |
86% |
56 |
| 4 |
109076 |
Matt Kocher |
86% |
37 |
| 5 |
279896 |
Ryan Bille |
83% |
36 |
Best Pole Percentage
drivers must have raced 8 or more weeks to feature in this table
| # |
groupid |
Driver |
Pole % |
Races |
| 1 |
107777 |
Ryan Kuhn |
98% |
57 |
| 2 |
404096 |
Jason Overton |
76% |
29 |
| 3 |
178325 |
Ryan J Kuhn |
68% |
28 |
| 4 |
620305 |
Cm Phillips |
62% |
29 |
| 5 |
645576 |
Michael Guderski |
60% |
20 |
Best Average iRating Gains
drivers must have raced 8 or more weeks to feature in this table
| # |
groupid |
Team |
Avg iRating +/- |
Races |
| 1 |
302666 |
Mark Neff |
52 |
28 |
| 2 |
470917 |
Aaron Smith15 |
46 |
11 |
| 3 |
68767 |
Kevin Fulton |
46 |
51 |
| 4 |
542451 |
Kyle Boone |
44 |
9 |
| 5 |
134861 |
Jay Horne |
43 |
20 |
Highest Total iRating Gains
| # |
groupid |
Team |
iRating +/- |
Races |
| 1 |
649506 |
Jeff Gerstenlauer |
4,389 |
202 |
| 2 |
54614 |
Bryan Narducci |
4,200 |
223 |
| 3 |
648160 |
James Slike |
4,090 |
180 |
| 4 |
279357 |
Austin Hawkins |
3,403 |
182 |
| 5 |
480499 |
Mark Smith30 |
3,258 |
142 |
Cleanest Drivers
drivers must have raced 8 or more weeks to feature in this table
| # |
groupid |
Team |
Inc / Corner |
Races |
| 1 |
543220 |
Gregory Hilber |
0.000 |
18 |
| 2 |
347842 |
Robert Keller3 |
0.002 |
24 |
| 3 |
178325 |
Ryan J Kuhn |
0.005 |
28 |
| 4 |
107838 |
Devin Allen |
0.006 |
32 |
| 5 |
510735 |
Troy Smith Jr |
0.006 |
21 |

![[Legacy] Charlotte Motor Speedway - 2008](https://images-static.iracing.com/img/logos/tracks/charlottemotorspeedway-logo.png)


