DIRTcar 358 Modified Engine Ice Series
2021 Season 4
- 7,063 unique drivers averaging 7.81 starts each.
- 710 drivers raced in 8 or more weeks.
- 4,722 official races with an average SOF of 1,657.
- 1,377,588 laps were completed with 137,224 incidents.
Week 1
Weedsport Speedway
- Total official races: 329
- Total drivers: 3,726
- Unique drivers: 1,598
- Highest SoF: 3,885
- Average SoF: 1,710
| # |
groupid |
Driver |
Points |
| 1 |
422059 |
Payton Talbot |
215 |
| 2 |
349924 |
Matt S Sanders |
206 |
| 3 |
374481 |
Brent D Carter |
199 |
Week 2
The Dirt Track at Charlotte
- Total official races: 436
- Total drivers: 5,146
- Unique drivers: 2,015
- Highest SoF: 3,865
- Average SoF: 1,686
| # |
groupid |
Driver |
Points |
| 1 |
343977 |
Dylan Yeager |
213 |
| 2 |
281243 |
Keith Hackney |
212 |
| 3 |
199459 |
Hunter Parsons |
196 |
Week 3
Volusia Speedway Park
- Total official races: 424
- Total drivers: 4,954
- Unique drivers: 1,898
- Highest SoF: 3,663
- Average SoF: 1,671
| # |
groupid |
Driver |
Points |
| 1 |
339010 |
Jamie Massey |
202 |
| 2 |
336218 |
Ludovic Buisson |
198 |
| 3 |
350879 |
Trent Miller |
196 |
Week 4
Bristol Motor Speedway
Dirt
- Total official races: 337
- Total drivers: 3,836
- Unique drivers: 1,764
- Highest SoF: 3,443
- Average SoF: 1,592
| # |
groupid |
Driver |
Points |
| 1 |
281243 |
Keith Hackney |
187 |
| 2 |
256860 |
Lyall Fisher |
179 |
| 3 |
422059 |
Payton Talbot |
176 |
Week 5
Williams Grove Speedway
- Total official races: 285
- Total drivers: 3,175
- Unique drivers: 1,454
- Highest SoF: 4,012
- Average SoF: 1,706
| # |
groupid |
Driver |
Points |
| 1 |
471691 |
Bradley White2 |
209 |
| 2 |
543336 |
James Richard2 |
190 |
| 3 |
183265 |
Brunson Behning2 |
189 |
Week 6
Lernerville Speedway
- Total official races: 370
- Total drivers: 4,280
- Unique drivers: 1,756
- Highest SoF: 3,576
- Average SoF: 1,714
| # |
groupid |
Driver |
Points |
| 1 |
517428 |
Austin Hunter7 |
199 |
| 2 |
514551 |
Shay Murphy |
198 |
| 3 |
543336 |
James Richard2 |
192 |
Week 7
Limaland Motorsports Park
- Total official races: 438
- Total drivers: 5,262
- Unique drivers: 1,981
- Highest SoF: 3,743
- Average SoF: 1,621
| # |
groupid |
Driver |
Points |
| 1 |
281243 |
Keith Hackney |
209 |
| 2 |
422059 |
Payton Talbot |
194 |
| 3 |
365802 |
Adam Holbert |
185 |
- Total official races: 443
- Total drivers: 5,280
- Unique drivers: 2,047
- Highest SoF: 4,058
- Average SoF: 1,651
| # |
groupid |
Driver |
Points |
| 1 |
349924 |
Matt S Sanders |
224 |
| 2 |
305439 |
Caleb Durgan |
207 |
| 3 |
276786 |
Zane Yost |
202 |
Week 9
Cedar Lake Speedway
- Total official races: 446
- Total drivers: 5,283
- Unique drivers: 1,952
- Highest SoF: 3,867
- Average SoF: 1,698
| # |
groupid |
Driver |
Points |
| 1 |
269643 |
Jesse Enterkin |
205 |
| 2 |
344734 |
Richie Yost |
205 |
| 3 |
610919 |
Daniel Mills5 |
203 |
- Total official races: 338
- Total drivers: 3,862
- Unique drivers: 1,518
- Highest SoF: 3,922
- Average SoF: 1,666
| # |
groupid |
Driver |
Points |
| 1 |
422059 |
Payton Talbot |
217 |
| 2 |
352997 |
Bryce Bailey |
198 |
| 3 |
276786 |
Zane Yost |
189 |
Week 11
USA International Speedway
Dirt
- Total official races: 484
- Total drivers: 5,778
- Unique drivers: 2,221
- Highest SoF: 4,022
- Average SoF: 1,608
| # |
groupid |
Driver |
Points |
| 1 |
422059 |
Payton Talbot |
223 |
| 2 |
276786 |
Zane Yost |
217 |
| 3 |
305439 |
Caleb Durgan |
204 |
Week 12
Knoxville Raceway
- Total official races: 392
- Total drivers: 4,580
- Unique drivers: 1,904
- Highest SoF: 3,222
- Average SoF: 1,582
| # |
groupid |
Driver |
Points |
| 1 |
506215 |
Dustin Henigan |
185 |
| 2 |
352015 |
Jayden Wolf |
177 |
| 3 |
276786 |
Zane Yost |
173 |
Historical Participation
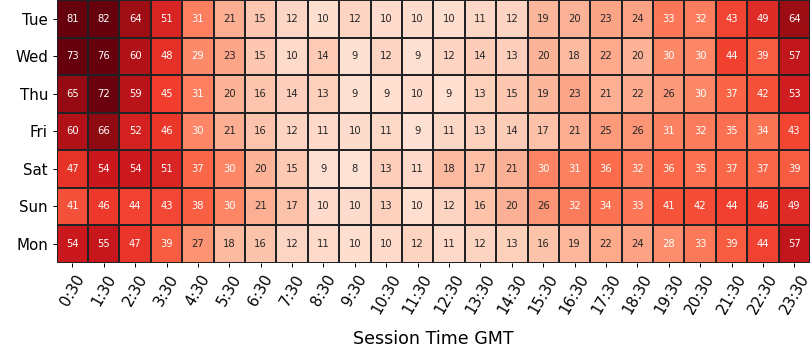
Participation
average number of drivers in each time slot
Strength of Field
average SoF of the top split for each time slot
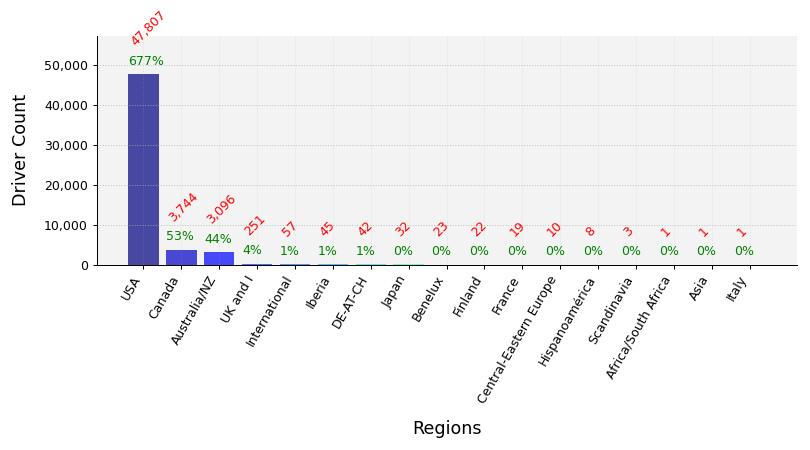
Clubs Distribution
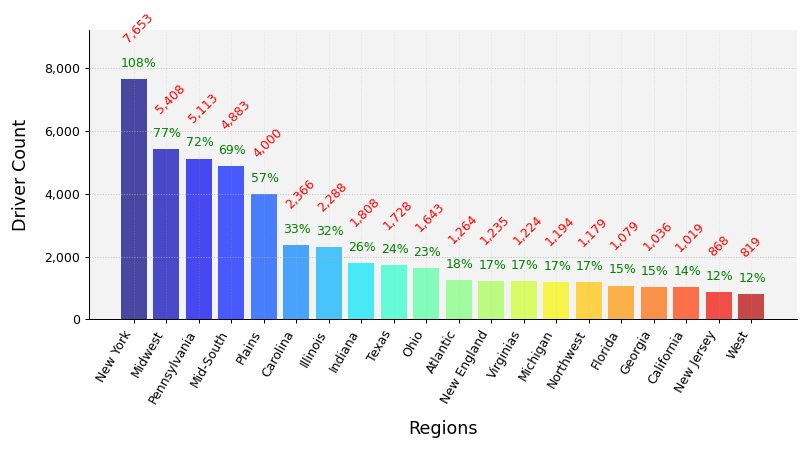
USA Clubs Distribution
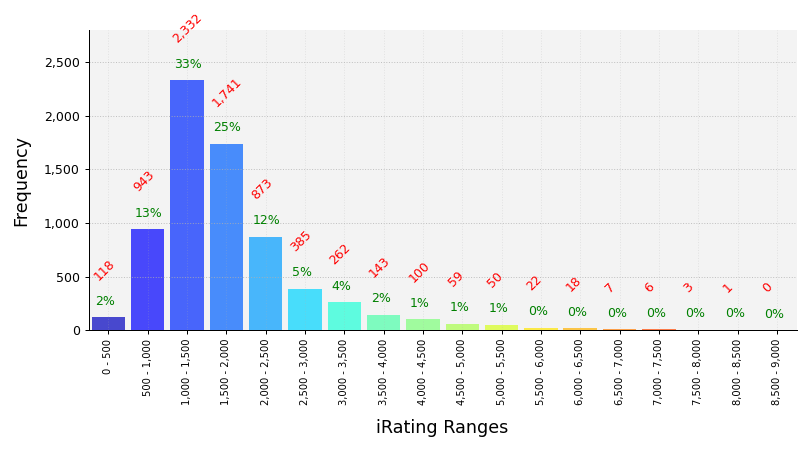
iRating Distribution
Championship Points
| # |
groupid |
Driver |
Points |
| 1 |
422059 |
Payton Talbot |
1,567 |
| 2 |
517428 |
Austin Hunter7 |
1,472 |
| 3 |
269643 |
Jesse Enterkin |
1,406 |
| 4 |
365802 |
Adam Holbert |
1,395 |
| 5 |
349924 |
Matt S Sanders |
1,391 |
Most Race Starts
| # |
groupid |
Driver |
Starts |
| 1 |
672844 |
Donald Krom |
323 |
| 2 |
346930 |
Pete Kiley |
198 |
| 3 |
648217 |
Robert Puckett2 |
181 |
| 4 |
626598 |
Norman Collis |
178 |
| 5 |
271984 |
Kelly Wheeler |
160 |
Grand Chelems
pole position, won race, fastest lap, led every lap (perfect if 0 inc)
| # |
groupid |
Driver |
Grand Chelems |
Chelem % |
Perfects |
| 1 |
684588 |
Aaron M Langley |
24 |
39% |
20 |
| 2 |
512783 |
Willy McClune |
21 |
32% |
18 |
| 3 |
623757 |
Noah Blankenship |
13 |
9% |
10 |
| 4 |
614760 |
Heather Justice |
12 |
24% |
8 |
| 5 |
443014 |
Shannon Rogers2 |
10 |
12% |
10 |
Average Finish Position
drivers must have raced 8 or more weeks to feature in this table
| # |
groupid |
Driver |
Avg Finish Pos |
Races |
| 1 |
269643 |
Jesse Enterkin |
1.7 |
58 |
| 2 |
295661 |
Christopher McGuire |
2.0 |
28 |
| 3 |
512783 |
Willy McClune |
2.1 |
66 |
| 4 |
567715 |
Nicholas Roberts6 |
2.2 |
56 |
| 5 |
422059 |
Payton Talbot |
2.3 |
16 |
Most Wins
| # |
groupid |
Driver |
Wins |
| 1 |
269643 |
Jesse Enterkin |
40 |
| 2 |
512783 |
Willy McClune |
37 |
| 3 |
684588 |
Aaron M Langley |
34 |
| 4 |
567715 |
Nicholas Roberts6 |
32 |
| 5 |
365802 |
Adam Holbert |
27 |
Most Podiums
| # |
groupid |
Driver |
Podiums |
| 1 |
672844 |
Donald Krom |
69 |
| 2 |
331821 |
Felix Paradis |
68 |
| 3 |
512783 |
Willy McClune |
60 |
| 4 |
269643 |
Jesse Enterkin |
55 |
| 5 |
684588 |
Aaron M Langley |
52 |
Most Poles
| # |
groupid |
Driver |
Poles |
| 1 |
512783 |
Willy McClune |
41 |
| 2 |
684588 |
Aaron M Langley |
36 |
| 3 |
623757 |
Noah Blankenship |
35 |
| 4 |
269643 |
Jesse Enterkin |
27 |
| 5 |
567715 |
Nicholas Roberts6 |
25 |
Best Win Percentage
drivers must have raced 8 or more weeks to feature in this table
| # |
groupid |
Driver |
Win % |
Races |
| 1 |
295661 |
Christopher McGuire |
75% |
28 |
| 2 |
422059 |
Payton Talbot |
75% |
16 |
| 3 |
269643 |
Jesse Enterkin |
69% |
58 |
| 4 |
276786 |
Zane Yost |
65% |
23 |
| 5 |
281243 |
Keith Hackney |
65% |
17 |
Best Podium Percentage
drivers must have raced 8 or more weeks to feature in this table
| # |
groupid |
Driver |
Podium % |
Races |
| 1 |
269643 |
Jesse Enterkin |
95% |
58 |
| 2 |
512783 |
Willy McClune |
91% |
66 |
| 3 |
567715 |
Nicholas Roberts6 |
88% |
56 |
| 4 |
429209 |
Tyler Kinsey |
88% |
32 |
| 5 |
422059 |
Payton Talbot |
88% |
16 |
Best Pole Percentage
drivers must have raced 8 or more weeks to feature in this table
| # |
groupid |
Driver |
Pole % |
Races |
| 1 |
276786 |
Zane Yost |
65% |
23 |
| 2 |
512783 |
Willy McClune |
62% |
66 |
| 3 |
295661 |
Christopher McGuire |
54% |
28 |
| 4 |
256860 |
Lyall Fisher |
52% |
29 |
| 5 |
157093 |
Kyall Fisher |
50% |
42 |
Best Average iRating Gains
drivers must have raced 8 or more weeks to feature in this table
| # |
groupid |
Team |
Avg iRating +/- |
Races |
| 1 |
485159 |
joe Trichilo |
41 |
18 |
| 2 |
567405 |
Dalton Unruh |
40 |
8 |
| 3 |
121001 |
Alex Crapser |
40 |
8 |
| 4 |
413678 |
Dale Houghtaling |
39 |
17 |
| 5 |
427120 |
Brandon Carvey |
38 |
14 |
Highest Total iRating Gains
| # |
groupid |
Team |
iRating +/- |
Races |
| 1 |
331821 |
Felix Paradis |
3,909 |
150 |
| 2 |
672844 |
Donald Krom |
2,738 |
323 |
| 3 |
277800 |
Charles Streeter |
2,528 |
96 |
| 4 |
684588 |
Aaron M Langley |
2,415 |
61 |
| 5 |
653390 |
Keith Lloyd2 |
2,076 |
128 |
Cleanest Drivers
drivers must have raced 8 or more weeks to feature in this table
| # |
groupid |
Team |
Inc / Corner |
Races |
| 1 |
429209 |
Tyler Kinsey |
0.005 |
32 |
| 2 |
269643 |
Jesse Enterkin |
0.007 |
58 |
| 3 |
51587 |
Travis Scroggins |
0.007 |
27 |
| 4 |
440716 |
Andrew Power |
0.007 |
8 |
| 5 |
119173 |
Justin Desrosiers |
0.008 |
20 |