Dirt Legends Cup
2021 Season 4
- 1,846 unique drivers averaging 2.15 starts each.
- 25 drivers raced in 8 or more weeks.
- 495 official races with an average SOF of 1,641.
- 87,257 laps were completed with 9,756 incidents.
Week 1
Lanier National Speedway
Dirt
- Total official races: 69
- Total drivers: 1,401
- Unique drivers: 836
- Highest SoF: 2,588
- Average SoF: 1,518
| # |
groupid |
Driver |
Points |
| 1 |
328096 |
Matt Ray |
137 |
| 2 |
215903 |
Connor Rockwood |
125 |
| 3 |
504555 |
Brian Warner3 |
122 |
Week 2
Limaland Motorsports Park
- Total official races: 41
- Total drivers: 926
- Unique drivers: 596
- Highest SoF: 4,407
- Average SoF: 1,768
| # |
groupid |
Driver |
Points |
| 1 |
325302 |
Thaddeus Marshall |
174 |
| 2 |
472401 |
Aston Rodriguez3 |
158 |
| 3 |
328096 |
Matt Ray |
139 |
Week 3
USA International Speedway
Dirt
- Total official races: 28
- Total drivers: 961
- Unique drivers: 602
- Highest SoF: 2,758
- Average SoF: 1,646
| # |
groupid |
Driver |
Points |
| 1 |
328096 |
Matt Ray |
144 |
| 2 |
63750 |
Tyler Shadduck |
131 |
| 3 |
331660 |
Carter Shank |
120 |
Week 4
Cedar Lake Speedway
- Total official races: 14
- Total drivers: 116
- Unique drivers: 83
- Highest SoF: 2,752
- Average SoF: 2,023
| # |
groupid |
Driver |
Points |
| 1 |
63750 |
Tyler Shadduck |
148 |
| 2 |
505231 |
Devon Byrd |
140 |
| 3 |
193113 |
Daniel Folds |
137 |
Week 5
Limaland Motorsports Park
- Total official races: 35
- Total drivers: 926
- Unique drivers: 596
- Highest SoF: 2,718
- Average SoF: 1,456
| # |
groupid |
Driver |
Points |
| 1 |
328096 |
Matt Ray |
142 |
| 2 |
63750 |
Tyler Shadduck |
126 |
| 3 |
437626 |
Myles Morse |
118 |
Week 6
Lanier National Speedway
Dirt
- Total official races: 47
- Total drivers: 1,401
- Unique drivers: 836
- Highest SoF: 2,622
- Average SoF: 1,538
| # |
groupid |
Driver |
Points |
| 1 |
328096 |
Matt Ray |
141 |
| 2 |
492740 |
Kenny Schaszberger |
122 |
| 3 |
292012 |
Chridtol Machart |
122 |
Week 7
USA International Speedway
Dirt
- Total official races: 34
- Total drivers: 961
- Unique drivers: 602
- Highest SoF: 2,722
- Average SoF: 1,703
| # |
groupid |
Driver |
Points |
| 1 |
471639 |
Curtis Critchley |
146 |
| 2 |
328096 |
Matt Ray |
128 |
| 3 |
368926 |
James Watson10 |
125 |
- Total official races: 30
- Total drivers: 240
- Unique drivers: 165
- Highest SoF: 3,826
- Average SoF: 1,920
| # |
groupid |
Driver |
Points |
| 1 |
615349 |
Isaac Smallwood |
189 |
| 2 |
331660 |
Carter Shank |
157 |
| 3 |
328096 |
Matt Ray |
152 |
Week 9
Limaland Motorsports Park
- Total official races: 43
- Total drivers: 926
- Unique drivers: 596
- Highest SoF: 2,294
- Average SoF: 1,524
| # |
groupid |
Driver |
Points |
| 1 |
63750 |
Tyler Shadduck |
126 |
| 2 |
328096 |
Matt Ray |
122 |
| 3 |
265205 |
Bradey McKenzie |
114 |
Week 10
Lanier National Speedway
Dirt
- Total official races: 56
- Total drivers: 1,401
- Unique drivers: 836
- Highest SoF: 3,006
- Average SoF: 1,683
| # |
groupid |
Driver |
Points |
| 1 |
328096 |
Matt Ray |
162 |
| 2 |
179160 |
Jeff Mills |
146 |
| 3 |
276130 |
Jeremy Root |
144 |
Week 11
USA International Speedway
Dirt
- Total official races: 60
- Total drivers: 961
- Unique drivers: 602
- Highest SoF: 4,183
- Average SoF: 1,616
| # |
groupid |
Driver |
Points |
| 1 |
328096 |
Matt Ray |
171 |
| 2 |
514551 |
Shay Murphy |
169 |
| 3 |
369732 |
Timmy Holmes |
167 |
- Total official races: 38
- Total drivers: 325
- Unique drivers: 237
- Highest SoF: 2,505
- Average SoF: 1,714
| # |
groupid |
Driver |
Points |
| 1 |
192328 |
Calen Mohler |
132 |
| 2 |
132797 |
Cristian Grady |
130 |
| 3 |
331660 |
Carter Shank |
125 |
Historical Participation
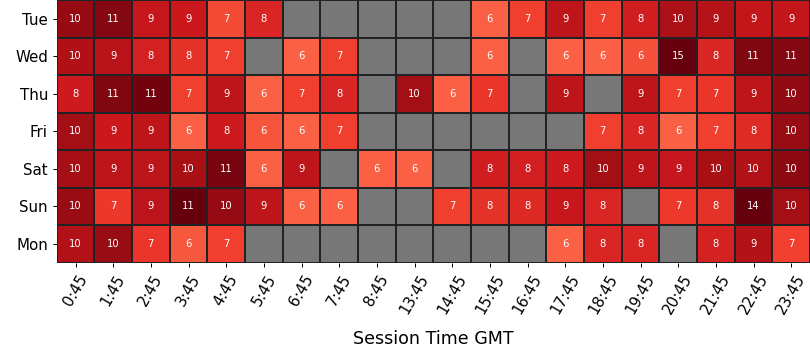
Participation
average number of drivers in each time slot
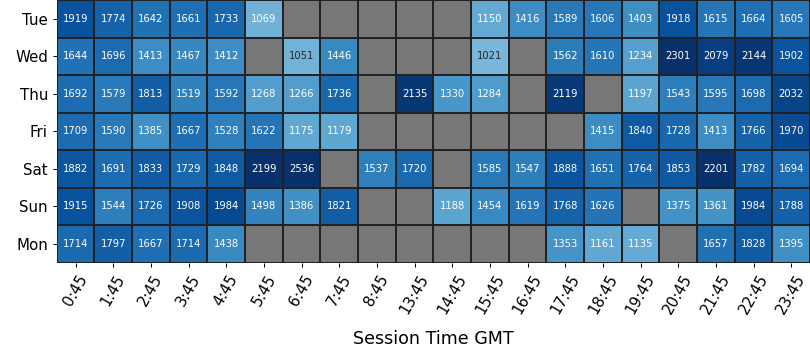
Strength of Field
average SoF of the top split for each time slot
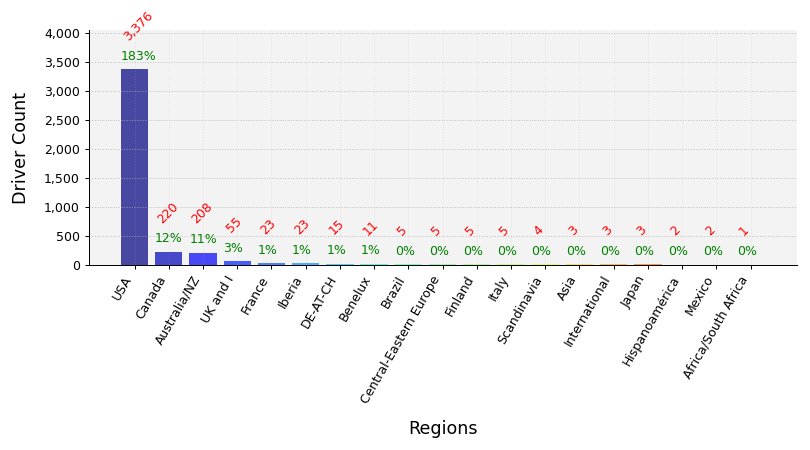
Clubs Distribution
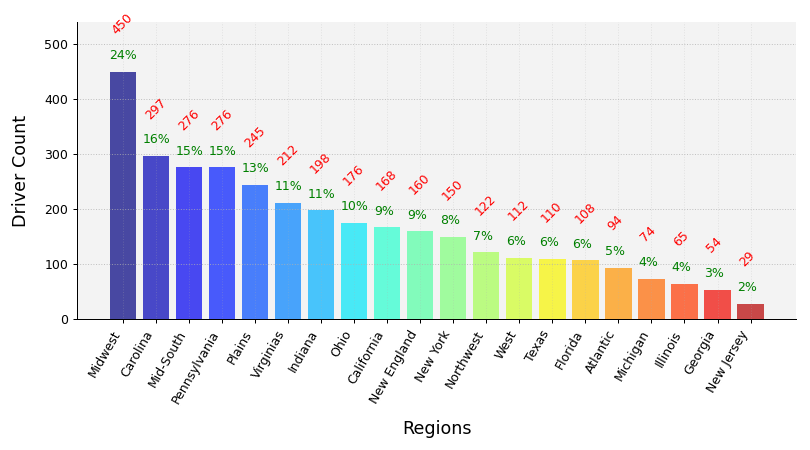
USA Clubs Distribution
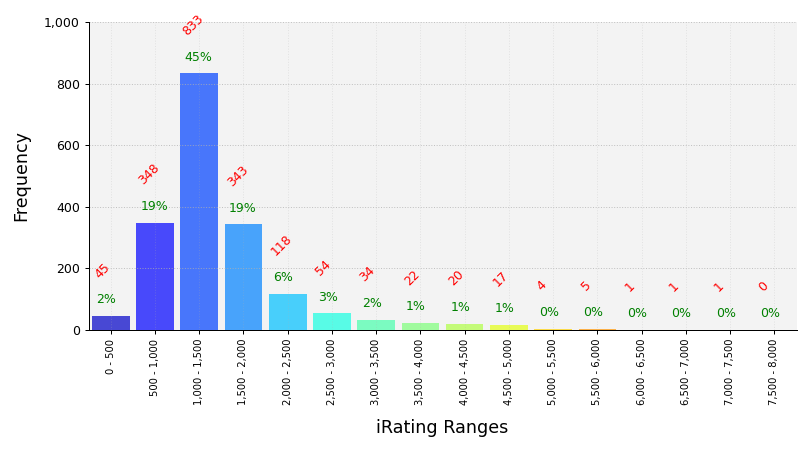
iRating Distribution
Championship Points
| # |
groupid |
Driver |
Points |
| 1 |
328096 |
Matt Ray |
1,188 |
| 2 |
63750 |
Tyler Shadduck |
1,022 |
| 3 |
269242 |
Matthew Ray |
956 |
| 4 |
331660 |
Carter Shank |
933 |
| 5 |
471639 |
Curtis Critchley |
884 |
Most Race Starts
| # |
groupid |
Driver |
Starts |
| 1 |
437626 |
Myles Morse |
49 |
| 2 |
331660 |
Carter Shank |
42 |
| 3 |
374558 |
Joel M Smith |
34 |
| 4 |
368926 |
James Watson10 |
32 |
| 5 |
328096 |
Matt Ray |
31 |
Grand Chelems
pole position, won race, fastest lap, led every lap (perfect if 0 inc)
| # |
groupid |
Driver |
Grand Chelems |
Chelem % |
Perfects |
| 1 |
328096 |
Matt Ray |
20 |
65% |
16 |
| 2 |
269242 |
Matthew Ray |
19 |
70% |
16 |
| 3 |
331660 |
Carter Shank |
17 |
40% |
13 |
| 4 |
63750 |
Tyler Shadduck |
9 |
35% |
8 |
| 5 |
265205 |
Bradey McKenzie |
9 |
36% |
6 |
Average Finish Position
drivers must have raced 8 or more weeks to feature in this table
| # |
groupid |
Driver |
Avg Finish Pos |
Races |
| 1 |
269242 |
Matthew Ray |
1.3 |
27 |
| 2 |
328096 |
Matt Ray |
1.7 |
31 |
| 3 |
331660 |
Carter Shank |
1.9 |
42 |
| 4 |
492740 |
Kenny Schaszberger |
2.1 |
16 |
| 5 |
368926 |
James Watson10 |
2.2 |
32 |
Most Wins
| # |
groupid |
Driver |
Wins |
| 1 |
328096 |
Matt Ray |
23 |
| 2 |
269242 |
Matthew Ray |
22 |
| 3 |
331660 |
Carter Shank |
20 |
| 4 |
63750 |
Tyler Shadduck |
17 |
| 5 |
265205 |
Bradey McKenzie |
15 |
Most Podiums
| # |
groupid |
Driver |
Podiums |
| 1 |
331660 |
Carter Shank |
38 |
| 2 |
437626 |
Myles Morse |
35 |
| 3 |
328096 |
Matt Ray |
28 |
| 4 |
368926 |
James Watson10 |
28 |
| 5 |
269242 |
Matthew Ray |
27 |
Most Poles
| # |
groupid |
Driver |
Poles |
| 1 |
328096 |
Matt Ray |
25 |
| 2 |
331660 |
Carter Shank |
22 |
| 3 |
269242 |
Matthew Ray |
21 |
| 4 |
63750 |
Tyler Shadduck |
17 |
| 5 |
34713 |
Anthony Collins |
13 |
Best Win Percentage
drivers must have raced 8 or more weeks to feature in this table
| # |
groupid |
Driver |
Win % |
Races |
| 1 |
269242 |
Matthew Ray |
81% |
27 |
| 2 |
328096 |
Matt Ray |
74% |
31 |
| 3 |
63750 |
Tyler Shadduck |
65% |
26 |
| 4 |
331660 |
Carter Shank |
48% |
42 |
| 5 |
98595 |
James Folds |
47% |
19 |
Best Podium Percentage
drivers must have raced 8 or more weeks to feature in this table
| # |
groupid |
Driver |
Podium % |
Races |
| 1 |
269242 |
Matthew Ray |
100% |
27 |
| 2 |
193113 |
Daniel Folds |
93% |
15 |
| 3 |
331660 |
Carter Shank |
90% |
42 |
| 4 |
328096 |
Matt Ray |
90% |
31 |
| 5 |
368926 |
James Watson10 |
88% |
32 |
Best Pole Percentage
drivers must have raced 8 or more weeks to feature in this table
| # |
groupid |
Driver |
Pole % |
Races |
| 1 |
328096 |
Matt Ray |
81% |
31 |
| 2 |
269242 |
Matthew Ray |
78% |
27 |
| 3 |
63750 |
Tyler Shadduck |
65% |
26 |
| 4 |
492740 |
Kenny Schaszberger |
56% |
16 |
| 5 |
34713 |
Anthony Collins |
54% |
24 |
Best Average iRating Gains
drivers must have raced 8 or more weeks to feature in this table
| # |
groupid |
Team |
Avg iRating +/- |
Races |
| 1 |
374558 |
Joel M Smith |
35 |
34 |
| 2 |
34713 |
Anthony Collins |
35 |
24 |
| 3 |
36232 |
Joshua Varga |
33 |
27 |
| 4 |
193113 |
Daniel Folds |
33 |
15 |
| 5 |
368926 |
James Watson10 |
29 |
32 |
Highest Total iRating Gains
| # |
groupid |
Team |
iRating +/- |
Races |
| 1 |
374558 |
Joel M Smith |
1,193 |
34 |
| 2 |
368926 |
James Watson10 |
930 |
32 |
| 3 |
36232 |
Joshua Varga |
884 |
27 |
| 4 |
331660 |
Carter Shank |
845 |
42 |
| 5 |
34713 |
Anthony Collins |
839 |
24 |
Cleanest Drivers
drivers must have raced 8 or more weeks to feature in this table
| # |
groupid |
Team |
Inc / Corner |
Races |
| 1 |
492740 |
Kenny Schaszberger |
0.005 |
16 |
| 2 |
193113 |
Daniel Folds |
0.006 |
15 |
| 3 |
63750 |
Tyler Shadduck |
0.007 |
26 |
| 4 |
31050 |
Joey Masiewicz |
0.008 |
12 |
| 5 |
328096 |
Matt Ray |
0.009 |
31 |