DIRTcar UMP Modified Series - Fixed
2021 Season 4
- 2,684 unique drivers averaging 4.20 starts each.
- 130 drivers raced in 8 or more weeks.
- 842 official races with an average SOF of 2,146.
- 265,514 laps were completed with 36,230 incidents.
Week 1
Cedar Lake Speedway
- Total official races: 93
- Total drivers: 1,313
- Unique drivers: 756
- Highest SoF: 4,249
- Average SoF: 2,193
| # |
groupid |
Driver |
Points |
| 1 |
344734 |
Richie Yost |
236 |
| 2 |
349924 |
Matt S Sanders |
232 |
| 3 |
276786 |
Zane Yost |
225 |
Week 2
Lernerville Speedway
- Total official races: 78
- Total drivers: 1,044
- Unique drivers: 641
- Highest SoF: 4,432
- Average SoF: 2,236
| # |
groupid |
Driver |
Points |
| 1 |
270576 |
Daren Friedman |
232 |
| 2 |
369202 |
Huey Quillen |
226 |
| 3 |
517428 |
Austin Hunter7 |
215 |
Week 3
The Dirt Track at Charlotte
- Total official races: 100
- Total drivers: 1,460
- Unique drivers: 793
- Highest SoF: 4,354
- Average SoF: 2,158
| # |
groupid |
Driver |
Points |
| 1 |
275393 |
Barrett Bishop |
236 |
| 2 |
369202 |
Huey Quillen |
234 |
| 3 |
309768 |
Wesley Gwaltney |
228 |
Week 4
Bristol Motor Speedway
Dirt
- Total official races: 79
- Total drivers: 1,049
- Unique drivers: 639
- Highest SoF: 3,883
- Average SoF: 1,992
| # |
groupid |
Driver |
Points |
| 1 |
302373 |
Kyler Bruce |
189 |
| 2 |
369202 |
Huey Quillen |
175 |
| 3 |
270469 |
Daniel Cassidy |
170 |
Week 5
Limaland Motorsports Park
- Total official races: 77
- Total drivers: 1,071
- Unique drivers: 632
- Highest SoF: 4,104
- Average SoF: 2,037
| # |
groupid |
Driver |
Points |
| 1 |
369202 |
Huey Quillen |
233 |
| 2 |
424352 |
Chase Hardy |
217 |
| 3 |
379315 |
Tyler J Worley |
201 |
- Total official races: 95
- Total drivers: 1,305
- Unique drivers: 725
- Highest SoF: 3,791
- Average SoF: 2,095
| # |
groupid |
Driver |
Points |
| 1 |
369202 |
Huey Quillen |
209 |
| 2 |
275149 |
Tanner Tomasi |
208 |
| 3 |
517428 |
Austin Hunter7 |
207 |
Week 7
Weedsport Speedway
- Total official races: 48
- Total drivers: 589
- Unique drivers: 374
- Highest SoF: 3,474
- Average SoF: 2,368
| # |
groupid |
Driver |
Points |
| 1 |
261989 |
Tyler D. Hudson |
191 |
| 2 |
124353 |
Nick Cooper |
188 |
| 3 |
349924 |
Matt S Sanders |
187 |
- Total official races: 46
- Total drivers: 568
- Unique drivers: 392
- Highest SoF: 3,750
- Average SoF: 2,181
| # |
groupid |
Driver |
Points |
| 1 |
239790 |
Greg Throne2 |
207 |
| 2 |
556569 |
Matthew Selby |
188 |
| 3 |
454073 |
Mitchell Clark2 |
173 |
Week 9
Williams Grove Speedway
- Total official races: 32
- Total drivers: 354
- Unique drivers: 261
- Highest SoF: 3,325
- Average SoF: 2,223
| # |
groupid |
Driver |
Points |
| 1 |
297239 |
Owen Storm |
186 |
| 2 |
369593 |
Dylan R Wilson |
169 |
| 3 |
502335 |
Jaron Valley |
152 |
Week 10
Knoxville Raceway
- Total official races: 71
- Total drivers: 963
- Unique drivers: 586
- Highest SoF: 3,928
- Average SoF: 2,138
| # |
groupid |
Driver |
Points |
| 1 |
612798 |
Devyn Nelsen |
222 |
| 2 |
503970 |
Jason Korn |
206 |
| 3 |
124353 |
Nick Cooper |
203 |
- Total official races: 49
- Total drivers: 596
- Unique drivers: 376
- Highest SoF: 3,112
- Average SoF: 2,142
| # |
groupid |
Driver |
Points |
| 1 |
474002 |
Mason Lobb |
182 |
| 2 |
295661 |
Christopher McGuire |
169 |
| 3 |
276786 |
Zane Yost |
167 |
Week 12
Volusia Speedway Park
- Total official races: 74
- Total drivers: 969
- Unique drivers: 544
- Highest SoF: 3,300
- Average SoF: 2,136
| # |
groupid |
Driver |
Points |
| 1 |
517428 |
Austin Hunter7 |
193 |
| 2 |
379315 |
Tyler J Worley |
180 |
| 3 |
346292 |
Joshua Hesson |
179 |
Historical Participation
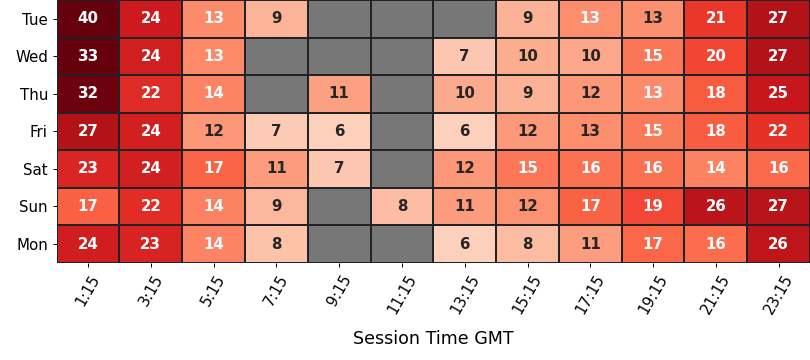
Participation
average number of drivers in each time slot
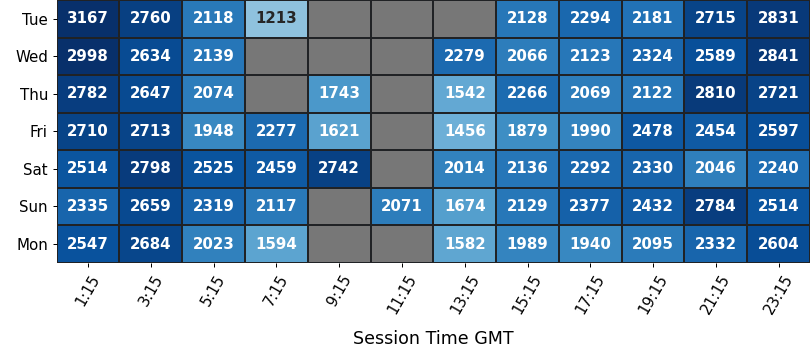
Strength of Field
average SoF of the top split for each time slot
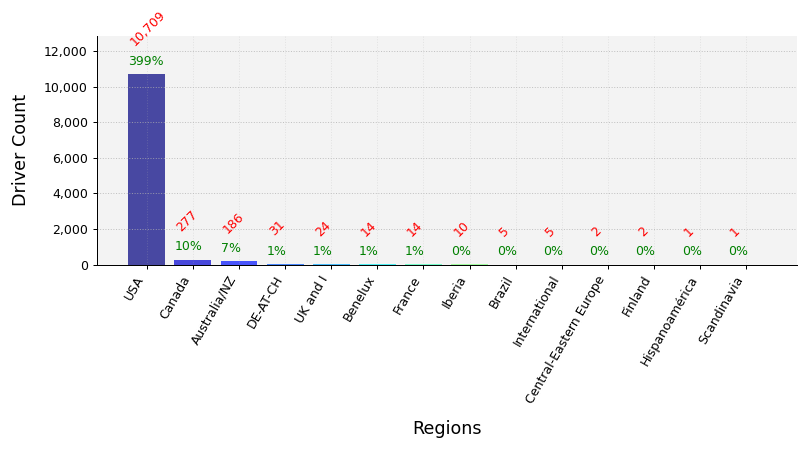
Clubs Distribution
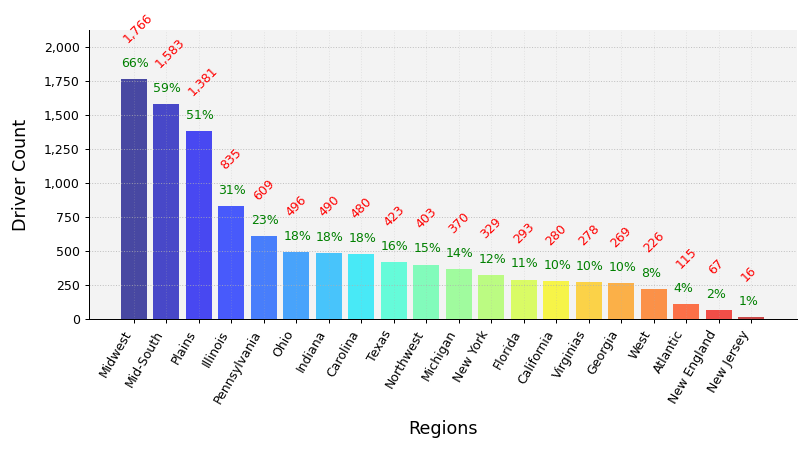
USA Clubs Distribution
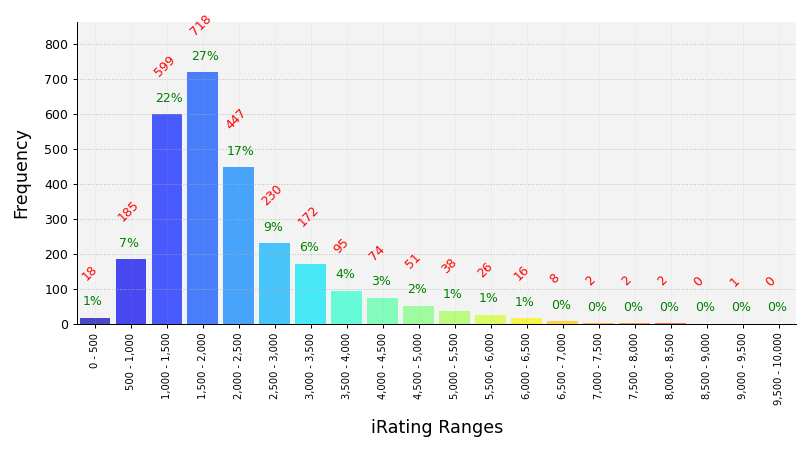
iRating Distribution
Championship Points
| # |
groupid |
Driver |
Points |
| 1 |
369202 |
Huey Quillen |
1,539 |
| 2 |
349924 |
Matt S Sanders |
1,499 |
| 3 |
517428 |
Austin Hunter7 |
1,425 |
| 4 |
273138 |
Nathan R Waddell |
1,284 |
| 5 |
302373 |
Kyler Bruce |
1,275 |
Most Race Starts
| # |
groupid |
Driver |
Starts |
| 1 |
296192 |
Matt Durbin |
113 |
| 2 |
621992 |
Michael Profitt |
111 |
| 3 |
515448 |
Ken Brown |
72 |
| 4 |
412669 |
Logan Naslund |
64 |
| 5 |
267483 |
Peter Wytaske |
57 |
Grand Chelems
pole position, won race, fastest lap, led every lap (perfect if 0 inc)
| # |
groupid |
Driver |
Grand Chelems |
Chelem % |
Perfects |
| 1 |
349924 |
Matt S Sanders |
15 |
47% |
11 |
| 2 |
369202 |
Huey Quillen |
11 |
21% |
8 |
| 3 |
621992 |
Michael Profitt |
6 |
5% |
5 |
| 4 |
429209 |
Tyler Kinsey |
5 |
22% |
2 |
| 5 |
597556 |
Brayden Burnett |
4 |
21% |
2 |
Average Finish Position
drivers must have raced 8 or more weeks to feature in this table
| # |
groupid |
Driver |
Avg Finish Pos |
Races |
| 1 |
349924 |
Matt S Sanders |
1.2 |
32 |
| 2 |
294945 |
Justin Norwood2 |
2.0 |
8 |
| 3 |
429209 |
Tyler Kinsey |
2.3 |
23 |
| 4 |
273138 |
Nathan R Waddell |
2.5 |
14 |
| 5 |
302373 |
Kyler Bruce |
2.7 |
20 |
Most Wins
| # |
groupid |
Driver |
Wins |
| 1 |
369202 |
Huey Quillen |
33 |
| 2 |
349924 |
Matt S Sanders |
24 |
| 3 |
559250 |
Chris Peters3 |
14 |
| 4 |
436857 |
Ty Norder |
12 |
| 5 |
350879 |
Trent Miller |
11 |
Most Podiums
| # |
groupid |
Driver |
Podiums |
| 1 |
369202 |
Huey Quillen |
41 |
| 2 |
621992 |
Michael Profitt |
40 |
| 3 |
349924 |
Matt S Sanders |
32 |
| 4 |
412669 |
Logan Naslund |
27 |
| 5 |
449005 |
Logan Koteles |
22 |
Most Poles
| # |
groupid |
Driver |
Poles |
| 1 |
369202 |
Huey Quillen |
27 |
| 2 |
349924 |
Matt S Sanders |
24 |
| 3 |
412669 |
Logan Naslund |
12 |
| 4 |
621992 |
Michael Profitt |
11 |
| 5 |
454073 |
Mitchell Clark2 |
9 |
Best Win Percentage
drivers must have raced 8 or more weeks to feature in this table
| # |
groupid |
Driver |
Win % |
Races |
| 1 |
349924 |
Matt S Sanders |
75% |
32 |
| 2 |
369202 |
Huey Quillen |
62% |
53 |
| 3 |
118355 |
Austin Simpson |
59% |
17 |
| 4 |
559250 |
Chris Peters3 |
50% |
28 |
| 5 |
429209 |
Tyler Kinsey |
43% |
23 |
Best Podium Percentage
drivers must have raced 8 or more weeks to feature in this table
| # |
groupid |
Driver |
Podium % |
Races |
| 1 |
349924 |
Matt S Sanders |
100% |
32 |
| 2 |
294945 |
Justin Norwood2 |
88% |
8 |
| 3 |
273138 |
Nathan R Waddell |
86% |
14 |
| 4 |
429209 |
Tyler Kinsey |
83% |
23 |
| 5 |
369202 |
Huey Quillen |
77% |
53 |
Best Pole Percentage
drivers must have raced 8 or more weeks to feature in this table
| # |
groupid |
Driver |
Pole % |
Races |
| 1 |
349924 |
Matt S Sanders |
75% |
32 |
| 2 |
369202 |
Huey Quillen |
51% |
53 |
| 3 |
294945 |
Justin Norwood2 |
50% |
8 |
| 4 |
302373 |
Kyler Bruce |
40% |
20 |
| 5 |
429209 |
Tyler Kinsey |
39% |
23 |
Best Average iRating Gains
drivers must have raced 8 or more weeks to feature in this table
| # |
groupid |
Team |
Avg iRating +/- |
Races |
| 1 |
586494 |
Gavin Martin2 |
41 |
13 |
| 2 |
288924 |
Gavin Ropchan |
35 |
12 |
| 3 |
272371 |
John Woodward Jr |
32 |
11 |
| 4 |
289475 |
Kenny Hinds |
31 |
17 |
| 5 |
70955 |
Kyle S Merkel |
30 |
12 |
Highest Total iRating Gains
| # |
groupid |
Team |
iRating +/- |
Races |
| 1 |
621992 |
Michael Profitt |
1,497 |
111 |
| 2 |
350879 |
Trent Miller |
1,365 |
28 |
| 3 |
296192 |
Matt Durbin |
1,180 |
113 |
| 4 |
412669 |
Logan Naslund |
1,095 |
64 |
| 5 |
562484 |
Andrew Harley2 |
1,039 |
50 |
Cleanest Drivers
drivers must have raced 8 or more weeks to feature in this table
| # |
groupid |
Team |
Inc / Corner |
Races |
| 1 |
294945 |
Justin Norwood2 |
0.008 |
8 |
| 2 |
671217 |
Robert Breneman |
0.011 |
12 |
| 3 |
416076 |
Brad Almond |
0.013 |
11 |
| 4 |
349924 |
Matt S Sanders |
0.013 |
32 |
| 5 |
204055 |
Corey M Boudinot |
0.013 |
10 |