Late Model Tour - Fixed
2021 Season 4
- 4,435 unique drivers averaging 3.08 starts each.
- 114 drivers raced in 8 or more weeks.
- 1,168 official races with an average SOF of 1,512.
- 576,310 laps were completed with 51,222 incidents.
Week 1
Southern National Motorsports Park
- Total official races: 131
- Total drivers: 1,601
- Unique drivers: 960
- Highest SoF: 2,888
- Average SoF: 1,489
| # |
groupid |
Driver |
Points |
| 1 |
82661 |
Cody Kelley |
164 |
| 2 |
576123 |
Jacob Putman2 |
160 |
| 3 |
315887 |
River Hays |
157 |
Week 2
Lucas Oil Raceway
Oval
- Total official races: 62
- Total drivers: 672
- Unique drivers: 462
- Highest SoF: 2,809
- Average SoF: 1,610
| # |
groupid |
Driver |
Points |
| 1 |
601579 |
Nik Locklair |
155 |
| 2 |
134640 |
James Linkiewicz |
154 |
| 3 |
82661 |
Cody Kelley |
147 |
Week 3
Hickory Motor Speedway
- Total official races: 67
- Total drivers: 739
- Unique drivers: 472
- Highest SoF: 3,719
- Average SoF: 1,697
| # |
groupid |
Driver |
Points |
| 1 |
234918 |
Devin Curl |
203 |
| 2 |
588536 |
Weston Ward |
182 |
| 3 |
28153 |
Jake Perkins |
163 |
Week 4
New Smyrna Speedway
- Total official races: 64
- Total drivers: 711
- Unique drivers: 489
- Highest SoF: 3,060
- Average SoF: 1,593
| # |
groupid |
Driver |
Points |
| 1 |
205688 |
James Scioly |
165 |
| 2 |
315887 |
River Hays |
158 |
| 3 |
49558 |
Brett Robinson |
148 |
- Total official races: 62
- Total drivers: 661
- Unique drivers: 439
- Highest SoF: 3,201
- Average SoF: 1,675
| # |
groupid |
Driver |
Points |
| 1 |
284230 |
Carter Russo |
175 |
| 2 |
54033 |
Nick DelCampo |
166 |
| 3 |
133913 |
Dave Coursol |
155 |
Week 6
Nashville Fairgrounds Speedway
Oval
- Total official races: 125
- Total drivers: 1,537
- Unique drivers: 873
- Highest SoF: 2,693
- Average SoF: 1,421
| # |
groupid |
Driver |
Points |
| 1 |
245847 |
Nick Snyder |
158 |
| 2 |
451344 |
TJ Burske |
154 |
| 3 |
180911 |
Josh Lowder |
146 |
Week 7
North Wilkesboro Speedway
1987
- Total official races: 102
- Total drivers: 1,150
- Unique drivers: 716
- Highest SoF: 3,026
- Average SoF: 1,507
| # |
groupid |
Driver |
Points |
| 1 |
315887 |
River Hays |
171 |
| 2 |
424718 |
Andrew Rutherford |
171 |
| 3 |
180911 |
Josh Lowder |
159 |
Week 8
Rockingham Speedway
Oval
- Total official races: 104
- Total drivers: 1,205
- Unique drivers: 701
- Highest SoF: 2,825
- Average SoF: 1,402
| # |
groupid |
Driver |
Points |
| 1 |
112135 |
Aaron Wisneski |
162 |
| 2 |
622704 |
DJ McCabe |
148 |
| 3 |
156749 |
Shawn M. Butler |
146 |
Week 9
Myrtle Beach Speedway
- Total official races: 82
- Total drivers: 924
- Unique drivers: 604
- Highest SoF: 2,743
- Average SoF: 1,536
| # |
groupid |
Driver |
Points |
| 1 |
111238 |
Dalton Collins |
153 |
| 2 |
20867 |
Charles Cosper |
150 |
| 3 |
315887 |
River Hays |
150 |
Week 10
South Boston Speedway
- Total official races: 149
- Total drivers: 1,835
- Unique drivers: 1,071
- Highest SoF: 3,141
- Average SoF: 1,408
| # |
groupid |
Driver |
Points |
| 1 |
33628 |
Paul Kusheba |
181 |
| 2 |
284230 |
Carter Russo |
167 |
| 3 |
112135 |
Aaron Wisneski |
159 |
Week 11
Martinsville Speedway
- Total official races: 121
- Total drivers: 1,447
- Unique drivers: 918
- Highest SoF: 2,873
- Average SoF: 1,528
| # |
groupid |
Driver |
Points |
| 1 |
494232 |
Brendan R Lee |
167 |
| 2 |
315887 |
River Hays |
164 |
| 3 |
33628 |
Paul Kusheba |
161 |
Week 12
Five Flags Speedway
- Total official races: 99
- Total drivers: 1,187
- Unique drivers: 736
- Highest SoF: 3,061
- Average SoF: 1,551
| # |
groupid |
Driver |
Points |
| 1 |
33988 |
Justin Brooks |
168 |
| 2 |
141401 |
Logan Powers |
163 |
| 3 |
82661 |
Cody Kelley |
160 |
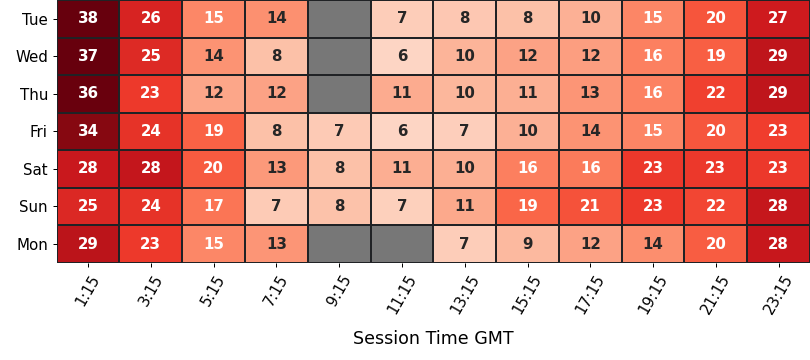
Historical Participation
Participation
average number of drivers in each time slot
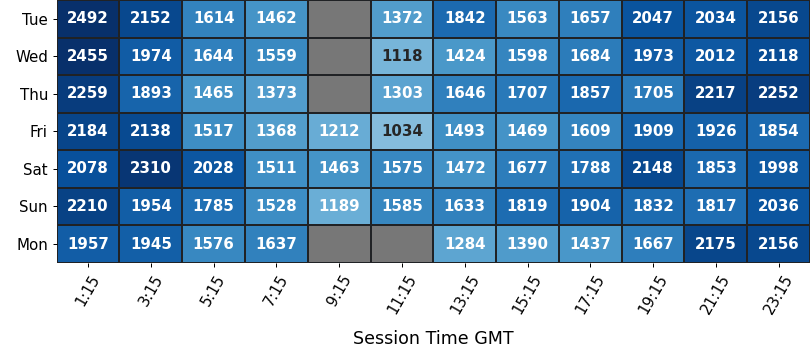
Strength of Field
average SoF of the top split for each time slot
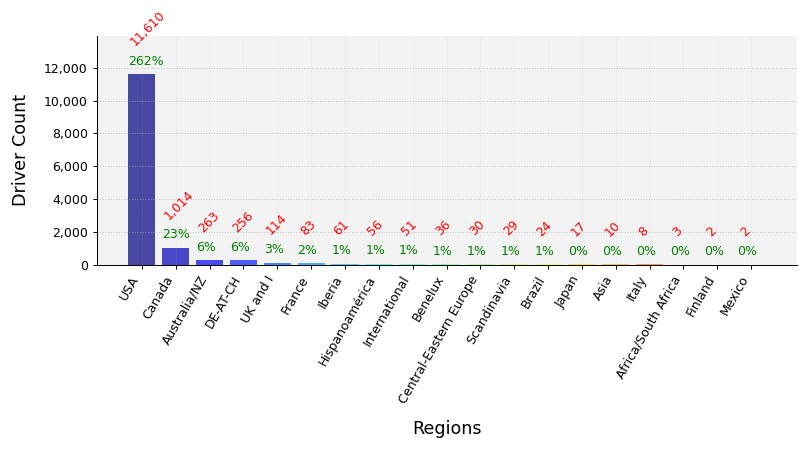
Clubs Distribution
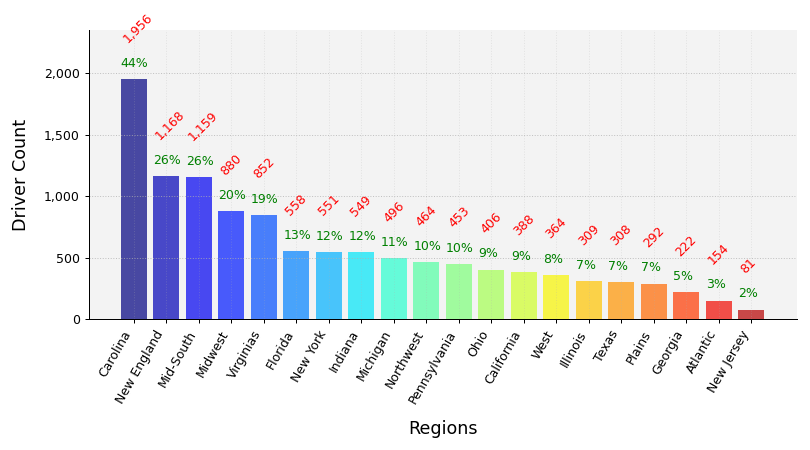
USA Clubs Distribution
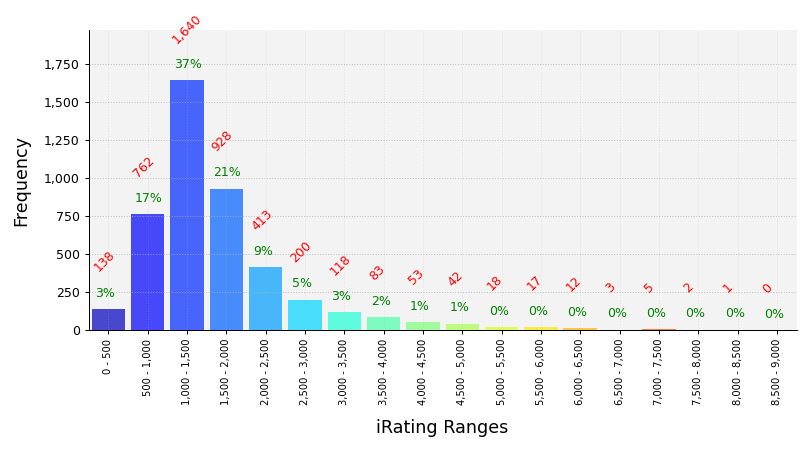
iRating Distribution
Championship Points
| # |
groupid |
Driver |
Points |
| 1 |
315887 |
River Hays |
1,238 |
| 2 |
494232 |
Brendan R Lee |
1,139 |
| 3 |
622704 |
DJ McCabe |
1,034 |
| 4 |
591031 |
Jared Jackson |
1,033 |
| 5 |
567634 |
Regan Ford |
1,022 |
Most Race Starts
| # |
groupid |
Driver |
Starts |
| 1 |
176451 |
Christopher Rives |
123 |
| 2 |
434300 |
William Scott8 |
70 |
| 3 |
633609 |
Anthony Scott4 |
59 |
| 4 |
669697 |
Michael Clapper3 |
56 |
| 5 |
292655 |
Ken Veaudry |
48 |
Grand Chelems
pole position, won race, fastest lap, led every lap (perfect if 0 inc)
| # |
groupid |
Driver |
Grand Chelems |
Chelem % |
Perfects |
| 1 |
315887 |
River Hays |
17 |
59% |
15 |
| 2 |
79074 |
Joel Blewitt |
16 |
100% |
15 |
| 3 |
101353 |
Aris Faria |
15 |
32% |
10 |
| 4 |
494232 |
Brendan R Lee |
13 |
31% |
13 |
| 5 |
216728 |
Joe Martinez Sr |
13 |
65% |
10 |
Average Finish Position
drivers must have raced 8 or more weeks to feature in this table
| # |
groupid |
Driver |
Avg Finish Pos |
Races |
| 1 |
315887 |
River Hays |
1.5 |
29 |
| 2 |
216728 |
Joe Martinez Sr |
1.6 |
20 |
| 3 |
584801 |
Nicholas Sweet |
2.2 |
10 |
| 4 |
622704 |
DJ McCabe |
2.2 |
33 |
| 5 |
20867 |
Charles Cosper |
2.3 |
12 |
Most Wins
| # |
groupid |
Driver |
Wins |
| 1 |
315887 |
River Hays |
24 |
| 2 |
494232 |
Brendan R Lee |
22 |
| 3 |
178082 |
Evan Hallstrom |
20 |
| 4 |
101353 |
Aris Faria |
18 |
| 5 |
622704 |
DJ McCabe |
16 |
Most Podiums
| # |
groupid |
Driver |
Podiums |
| 1 |
101353 |
Aris Faria |
38 |
| 2 |
178082 |
Evan Hallstrom |
33 |
| 3 |
494232 |
Brendan R Lee |
33 |
| 4 |
622704 |
DJ McCabe |
30 |
| 5 |
315887 |
River Hays |
27 |
Most Poles
| # |
groupid |
Driver |
Poles |
| 1 |
494232 |
Brendan R Lee |
25 |
| 2 |
101353 |
Aris Faria |
24 |
| 3 |
315887 |
River Hays |
24 |
| 4 |
622704 |
DJ McCabe |
22 |
| 5 |
216728 |
Joe Martinez Sr |
16 |
Best Win Percentage
drivers must have raced 8 or more weeks to feature in this table
| # |
groupid |
Driver |
Win % |
Races |
| 1 |
315887 |
River Hays |
83% |
29 |
| 2 |
216728 |
Joe Martinez Sr |
80% |
20 |
| 3 |
20867 |
Charles Cosper |
75% |
12 |
| 4 |
584801 |
Nicholas Sweet |
70% |
10 |
| 5 |
494232 |
Brendan R Lee |
52% |
42 |
Best Podium Percentage
drivers must have raced 8 or more weeks to feature in this table
| # |
groupid |
Driver |
Podium % |
Races |
| 1 |
315887 |
River Hays |
93% |
29 |
| 2 |
622704 |
DJ McCabe |
91% |
33 |
| 3 |
133913 |
Dave Coursol |
91% |
11 |
| 4 |
216728 |
Joe Martinez Sr |
90% |
20 |
| 5 |
584801 |
Nicholas Sweet |
90% |
10 |
Best Pole Percentage
drivers must have raced 8 or more weeks to feature in this table
| # |
groupid |
Driver |
Pole % |
Races |
| 1 |
315887 |
River Hays |
83% |
29 |
| 2 |
216728 |
Joe Martinez Sr |
80% |
20 |
| 3 |
20867 |
Charles Cosper |
75% |
12 |
| 4 |
622704 |
DJ McCabe |
67% |
33 |
| 5 |
494232 |
Brendan R Lee |
60% |
42 |
Best Average iRating Gains
drivers must have raced 8 or more weeks to feature in this table
| # |
groupid |
Team |
Avg iRating +/- |
Races |
| 1 |
584801 |
Nicholas Sweet |
73 |
10 |
| 2 |
415549 |
Eric Hemmerich |
58 |
11 |
| 3 |
595381 |
Ryan Pittman |
44 |
16 |
| 4 |
612699 |
Chris Oliveira |
36 |
13 |
| 5 |
579406 |
Timothy Lewis4 |
33 |
10 |
Highest Total iRating Gains
| # |
groupid |
Team |
iRating +/- |
Races |
| 1 |
101353 |
Aris Faria |
1,476 |
47 |
| 2 |
494232 |
Brendan R Lee |
977 |
42 |
| 3 |
423452 |
Chase Silvia |
917 |
22 |
| 4 |
622704 |
DJ McCabe |
897 |
33 |
| 5 |
454693 |
Doreen Silva |
839 |
22 |
Cleanest Drivers
drivers must have raced 8 or more weeks to feature in this table
| # |
groupid |
Team |
Inc / Corner |
Races |
| 1 |
20867 |
Charles Cosper |
0.000 |
12 |
| 2 |
315887 |
River Hays |
0.003 |
29 |
| 3 |
481389 |
Mike Harris2 |
0.006 |
13 |
| 4 |
454524 |
Rolland Croteau2 |
0.006 |
8 |
| 5 |
513055 |
Courtney Gard |
0.007 |
13 |