Pro 2 & Pro 4 Off-Road Racing Series
2021 Season 4
Pro 2
- 69 unique drivers averaging 3.43 starts each.
- 8 drivers raced in 8 or more weeks.
- 115 official races with an average SOF of 1,511.
- 2,924 laps were completed with 336 incidents.
Week 1
Crandon International Raceway
Full
- Total official races: 12
- Total drivers: 57
- Unique drivers: 32
- Highest SoF: 2,303
- Average SoF: 708
| # |
groupid |
Driver |
Points |
| 1 |
339159 |
Josh Edmundson |
99 |
| 2 |
288690 |
Greg Johnson3 |
99 |
| 3 |
368926 |
James Watson10 |
96 |
Week 2
Bark River International Raceway
- Total official races: 11
- Total drivers: 59
- Unique drivers: 34
- Highest SoF: 4,456
- Average SoF: 1,205
| # |
groupid |
Driver |
Points |
| 1 |
288690 |
Greg Johnson3 |
162 |
| 2 |
368926 |
James Watson10 |
108 |
| 3 |
552357 |
Keaton Swane |
101 |
Week 3
Wild Horse Pass Motorsports Park
- Total official races: 10
- Total drivers: 37
- Unique drivers: 20
- Highest SoF: 3,429
- Average SoF: 1,136
| # |
groupid |
Driver |
Points |
| 1 |
407121 |
Tyson Miller |
131 |
| 2 |
527540 |
Leo Moura |
104 |
| 3 |
368926 |
James Watson10 |
96 |
Week 4
Crandon International Raceway
Short
- Total official races: 11
- Total drivers: 46
- Unique drivers: 21
- Highest SoF: 4,141
- Average SoF: 1,788
| # |
groupid |
Driver |
Points |
| 1 |
407121 |
Tyson Miller |
141 |
| 2 |
288690 |
Greg Johnson3 |
137 |
| 3 |
437626 |
Myles Morse |
118 |
Week 5
Wild West Motorsports Park
- Total official races: 11
- Total drivers: 38
- Unique drivers: 26
- Highest SoF: 3,575
- Average SoF: 1,455
| # |
groupid |
Driver |
Points |
| 1 |
412172 |
Gary Greene3 |
142 |
| 2 |
301473 |
Kenneth Ashlock |
138 |
| 3 |
447929 |
Jeff Johnson7 |
129 |
Week 6
Crandon International Raceway
Full
- Total official races: 11
- Total drivers: 57
- Unique drivers: 32
- Highest SoF: 2,772
- Average SoF: 1,441
| # |
groupid |
Driver |
Points |
| 1 |
664623 |
Shea Price |
112 |
| 2 |
368926 |
James Watson10 |
109 |
| 3 |
288690 |
Greg Johnson3 |
91 |
Week 7
Bark River International Raceway
- Total official races: 11
- Total drivers: 59
- Unique drivers: 34
- Highest SoF: 4,538
- Average SoF: 1,506
| # |
groupid |
Driver |
Points |
| 1 |
407121 |
Tyson Miller |
143 |
| 2 |
172913 |
Zach Knowles2 |
126 |
| 3 |
437626 |
Myles Morse |
107 |
Week 8
Wild Horse Pass Motorsports Park
- Total official races: 10
- Total drivers: 37
- Unique drivers: 20
- Highest SoF: 4,039
- Average SoF: 1,646
| # |
groupid |
Driver |
Points |
| 1 |
407121 |
Tyson Miller |
150 |
| 2 |
368926 |
James Watson10 |
144 |
| 3 |
288690 |
Greg Johnson3 |
141 |
Week 9
Crandon International Raceway
Short
- Total official races: 10
- Total drivers: 46
- Unique drivers: 21
- Highest SoF: 3,525
- Average SoF: 1,368
| # |
groupid |
Driver |
Points |
| 1 |
288690 |
Greg Johnson3 |
158 |
| 2 |
447929 |
Jeff Johnson7 |
131 |
| 3 |
407121 |
Tyson Miller |
127 |
Week 10
Wild West Motorsports Park
- Total official races: 4
- Total drivers: 38
- Unique drivers: 26
- Highest SoF: 3,695
- Average SoF: 3,342
| # |
groupid |
Driver |
Points |
| 1 |
368926 |
James Watson10 |
159 |
| 2 |
552385 |
Jeff Porras |
127 |
| 3 |
360483 |
Jeff Mapes |
127 |
Week 11
Bark River International Raceway
- Total official races: 8
- Total drivers: 59
- Unique drivers: 34
- Highest SoF: 4,807
- Average SoF: 1,803
| # |
groupid |
Driver |
Points |
| 1 |
288690 |
Greg Johnson3 |
181 |
| 2 |
664623 |
Shea Price |
181 |
| 3 |
368926 |
James Watson10 |
135 |
Week 12
Crandon International Raceway
Full
- Total official races: 6
- Total drivers: 57
- Unique drivers: 32
- Highest SoF: 4,026
- Average SoF: 2,429
| # |
groupid |
Driver |
Points |
| 1 |
288690 |
Greg Johnson3 |
186 |
| 2 |
565273 |
Trent Dinkel |
148 |
| 3 |
368926 |
James Watson10 |
125 |
Historical Participation
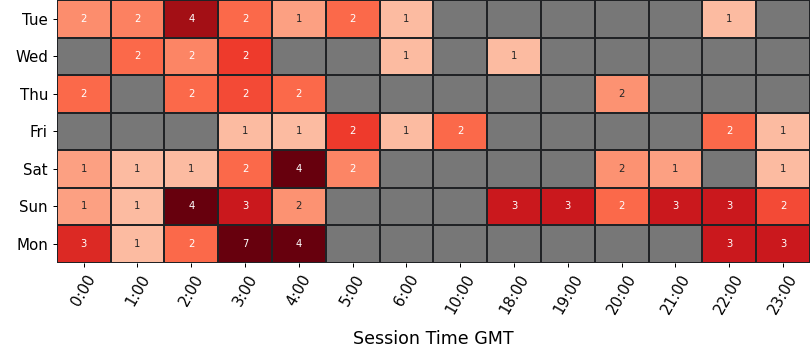
Participation
average number of drivers in each time slot
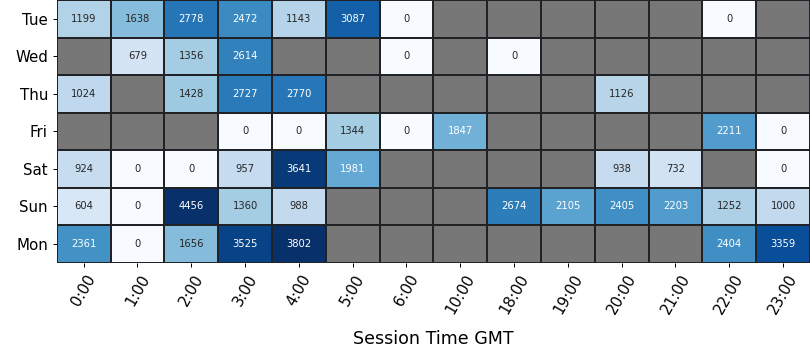
Strength of Field
average SoF of the top split for each time slot
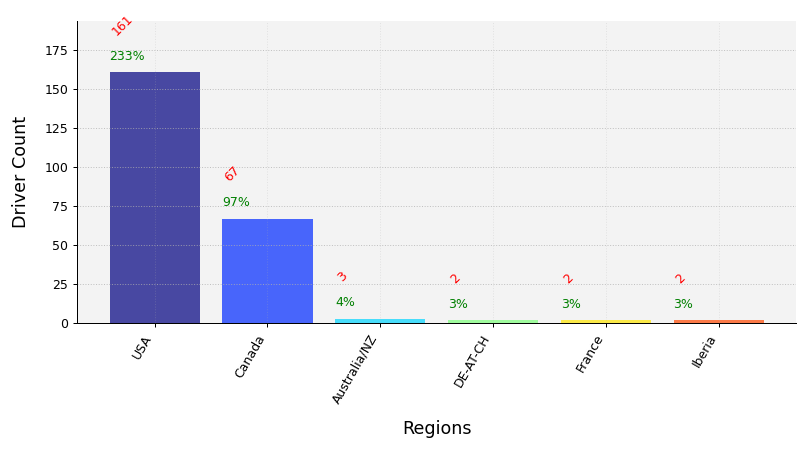
Clubs Distribution
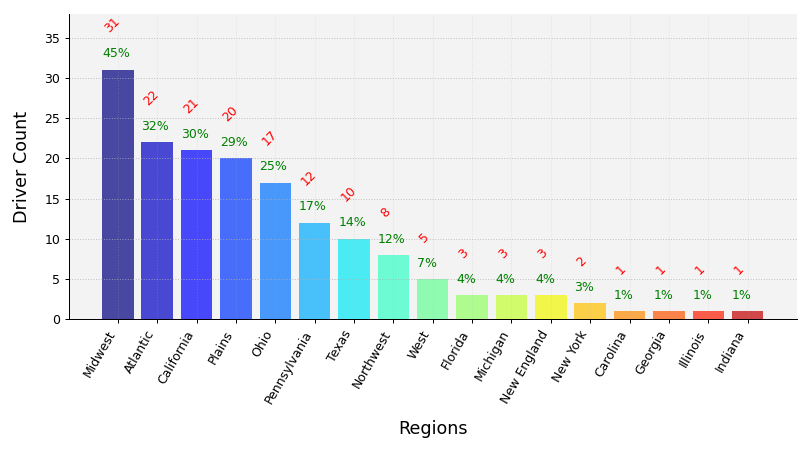
USA Clubs Distribution
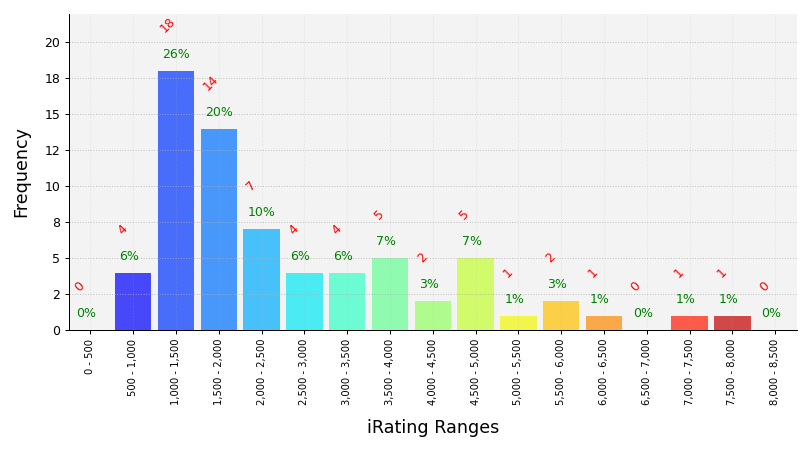
iRating Distribution
Championship Points
| # |
groupid |
Driver |
Points |
| 1 |
288690 |
Greg Johnson3 |
1,170 |
| 2 |
407121 |
Tyson Miller |
1,017 |
| 3 |
368926 |
James Watson10 |
972 |
| 4 |
447929 |
Jeff Johnson7 |
761 |
| 5 |
437626 |
Myles Morse |
660 |
Most Race Starts
| # |
groupid |
Driver |
Starts |
| 1 |
288690 |
Greg Johnson3 |
28 |
| 2 |
447929 |
Jeff Johnson7 |
24 |
| 3 |
368926 |
James Watson10 |
17 |
| 4 |
437626 |
Myles Morse |
14 |
| 5 |
407121 |
Tyson Miller |
13 |
Grand Chelems
pole position, won race, fastest lap, led every lap (perfect if 0 inc)
| # |
groupid |
Driver |
Grand Chelems |
Chelem % |
Perfects |
| 1 |
288690 |
Greg Johnson3 |
17 |
61% |
10 |
| 2 |
407121 |
Tyson Miller |
11 |
85% |
10 |
| 3 |
447929 |
Jeff Johnson7 |
8 |
33% |
7 |
| 4 |
368926 |
James Watson10 |
7 |
41% |
3 |
| 5 |
611825 |
James Brooks18 |
6 |
55% |
5 |
Average Finish Position
drivers must have raced 8 or more weeks to feature in this table
| # |
groupid |
Driver |
Avg Finish Pos |
Races |
| 1 |
407121 |
Tyson Miller |
1.1 |
13 |
| 2 |
310221 |
Joe LaPhilliph |
1.2 |
8 |
| 3 |
611825 |
James Brooks18 |
1.5 |
11 |
| 4 |
288690 |
Greg Johnson3 |
1.5 |
28 |
| 5 |
447929 |
Jeff Johnson7 |
2.0 |
24 |
Most Wins
| # |
groupid |
Driver |
Wins |
| 1 |
288690 |
Greg Johnson3 |
19 |
| 2 |
407121 |
Tyson Miller |
12 |
| 3 |
447929 |
Jeff Johnson7 |
10 |
| 4 |
368926 |
James Watson10 |
8 |
| 5 |
310221 |
Joe LaPhilliph |
6 |
Most Podiums
| # |
groupid |
Driver |
Podiums |
| 1 |
288690 |
Greg Johnson3 |
26 |
| 2 |
447929 |
Jeff Johnson7 |
22 |
| 3 |
368926 |
James Watson10 |
15 |
| 4 |
407121 |
Tyson Miller |
13 |
| 5 |
611825 |
James Brooks18 |
11 |
Most Poles
| # |
groupid |
Driver |
Poles |
| 1 |
288690 |
Greg Johnson3 |
20 |
| 2 |
407121 |
Tyson Miller |
12 |
| 3 |
447929 |
Jeff Johnson7 |
9 |
| 4 |
368926 |
James Watson10 |
7 |
| 5 |
664623 |
Shea Price |
7 |
Best Win Percentage
drivers must have raced 8 or more weeks to feature in this table
| # |
groupid |
Driver |
Win % |
Races |
| 1 |
407121 |
Tyson Miller |
92% |
13 |
| 2 |
310221 |
Joe LaPhilliph |
75% |
8 |
| 3 |
288690 |
Greg Johnson3 |
68% |
28 |
| 4 |
611825 |
James Brooks18 |
55% |
11 |
| 5 |
368926 |
James Watson10 |
47% |
17 |
Best Podium Percentage
drivers must have raced 8 or more weeks to feature in this table
| # |
groupid |
Driver |
Podium % |
Races |
| 1 |
407121 |
Tyson Miller |
100% |
13 |
| 2 |
611825 |
James Brooks18 |
100% |
11 |
| 3 |
372497 |
James Hoffer |
100% |
8 |
| 4 |
310221 |
Joe LaPhilliph |
100% |
8 |
| 5 |
288690 |
Greg Johnson3 |
93% |
28 |
Best Pole Percentage
drivers must have raced 8 or more weeks to feature in this table
| # |
groupid |
Driver |
Pole % |
Races |
| 1 |
407121 |
Tyson Miller |
92% |
13 |
| 2 |
288690 |
Greg Johnson3 |
71% |
28 |
| 3 |
611825 |
James Brooks18 |
64% |
11 |
| 4 |
310221 |
Joe LaPhilliph |
62% |
8 |
| 5 |
372497 |
James Hoffer |
50% |
8 |
Best Average iRating Gains
drivers must have raced 8 or more weeks to feature in this table
| # |
groupid |
Team |
Avg iRating +/- |
Races |
| 1 |
288690 |
Greg Johnson3 |
17 |
28 |
| 2 |
447929 |
Jeff Johnson7 |
16 |
24 |
| 3 |
310221 |
Joe LaPhilliph |
12 |
8 |
| 4 |
407121 |
Tyson Miller |
12 |
13 |
| 5 |
611825 |
James Brooks18 |
6 |
11 |
Highest Total iRating Gains
| # |
groupid |
Team |
iRating +/- |
Races |
| 1 |
288690 |
Greg Johnson3 |
471 |
28 |
| 2 |
447929 |
Jeff Johnson7 |
380 |
24 |
| 3 |
407121 |
Tyson Miller |
150 |
13 |
| 4 |
172913 |
Zach Knowles2 |
94 |
3 |
| 5 |
310221 |
Joe LaPhilliph |
93 |
8 |
Cleanest Drivers
drivers must have raced 8 or more weeks to feature in this table
| # |
groupid |
Team |
Inc / Corner |
Races |
| 1 |
310221 |
Joe LaPhilliph |
0.000 |
8 |
| 2 |
407121 |
Tyson Miller |
0.003 |
13 |
| 3 |
447929 |
Jeff Johnson7 |
0.009 |
24 |
| 4 |
372497 |
James Hoffer |
0.010 |
8 |
| 5 |
611825 |
James Brooks18 |
0.014 |
11 |