SK Modified Weekly Series - Fixed
2021 Season 4
- 4,260 unique drivers averaging 3.69 starts each.
- 155 drivers raced in 8 or more weeks.
- 1,295 official races with an average SOF of 1,490.
- 505,007 laps were completed with 76,042 incidents.
- Total official races: 106
- Total drivers: 1,301
- Unique drivers: 807
- Highest SoF: 2,884
- Average SoF: 1,526
| # |
groupid |
Driver |
Points |
| 1 |
583685 |
Richard Landreth |
160 |
| 2 |
567634 |
Regan Ford |
158 |
| 3 |
318658 |
Kyle Edgar |
152 |
- Total official races: 61
- Total drivers: 696
- Unique drivers: 419
- Highest SoF: 3,306
- Average SoF: 1,662
| # |
groupid |
Driver |
Points |
| 1 |
318658 |
Kyle Edgar |
181 |
| 2 |
45599 |
Kevin Ammon |
174 |
| 3 |
446591 |
Jonathan Tuckness |
168 |
Week 3
Thompson Speedway Motorsports Park
Oval
- Total official races: 122
- Total drivers: 1,537
- Unique drivers: 933
- Highest SoF: 3,009
- Average SoF: 1,492
| # |
groupid |
Driver |
Points |
| 1 |
120330 |
Parker Retzlaff |
173 |
| 2 |
318658 |
Kyle Edgar |
170 |
| 3 |
110893 |
Kyle B Scisco |
160 |
Week 4
Martinsville Speedway
- Total official races: 101
- Total drivers: 1,199
- Unique drivers: 747
- Highest SoF: 3,522
- Average SoF: 1,541
| # |
groupid |
Driver |
Points |
| 1 |
356907 |
Racin Vernon |
198 |
| 2 |
314277 |
Marcus Fruchtenicht |
181 |
| 3 |
54614 |
Bryan Narducci |
165 |
Week 5
North Wilkesboro Speedway
1987
- Total official races: 100
- Total drivers: 1,181
- Unique drivers: 702
- Highest SoF: 2,958
- Average SoF: 1,496
| # |
groupid |
Driver |
Points |
| 1 |
318658 |
Kyle Edgar |
166 |
| 2 |
619791 |
Cameron Billings |
163 |
| 3 |
504538 |
Luke G Baldwin |
163 |
Week 6
Hickory Motor Speedway
- Total official races: 85
- Total drivers: 967
- Unique drivers: 557
- Highest SoF: 2,882
- Average SoF: 1,544
| # |
groupid |
Driver |
Points |
| 1 |
482170 |
Ken Biron |
164 |
| 2 |
149190 |
Mathew Chastain |
149 |
| 3 |
318658 |
Kyle Edgar |
145 |
Week 7
Lanier National Speedway
Asphalt
- Total official races: 127
- Total drivers: 1,578
- Unique drivers: 896
- Highest SoF: 3,257
- Average SoF: 1,459
| # |
groupid |
Driver |
Points |
| 1 |
83515 |
Chase Robertson |
187 |
| 2 |
79897 |
Mike Christopher Jr |
173 |
| 3 |
75290 |
Ryan Lutz |
169 |
Week 8
Lucas Oil Raceway
Oval
- Total official races: 82
- Total drivers: 914
- Unique drivers: 547
- Highest SoF: 2,857
- Average SoF: 1,479
| # |
groupid |
Driver |
Points |
| 1 |
33988 |
Justin Brooks |
144 |
| 2 |
650065 |
Kevin Boylan |
139 |
| 3 |
33263 |
Britt Vanmeter |
136 |
Week 9
Southern National Motorsports Park
- Total official races: 165
- Total drivers: 2,168
- Unique drivers: 1,153
- Highest SoF: 3,289
- Average SoF: 1,420
| # |
groupid |
Driver |
Points |
| 1 |
619791 |
Cameron Billings |
189 |
| 2 |
426482 |
Scott Serydynski |
164 |
| 3 |
318658 |
Kyle Edgar |
163 |
Week 10
Myrtle Beach Speedway
- Total official races: 105
- Total drivers: 1,244
- Unique drivers: 647
- Highest SoF: 3,163
- Average SoF: 1,472
| # |
groupid |
Driver |
Points |
| 1 |
425942 |
Kaleb Hall |
168 |
| 2 |
33988 |
Justin Brooks |
165 |
| 3 |
75290 |
Ryan Lutz |
165 |
Week 11
Iowa Speedway
Oval
- Total official races: 122
- Total drivers: 1,486
- Unique drivers: 804
- Highest SoF: 3,513
- Average SoF: 1,441
| # |
groupid |
Driver |
Points |
| 1 |
369732 |
Timmy Holmes |
198 |
| 2 |
314277 |
Marcus Fruchtenicht |
185 |
| 3 |
353641 |
Talon Pelfrey |
173 |
Week 12
South Boston Speedway
- Total official races: 119
- Total drivers: 1,450
- Unique drivers: 870
- Highest SoF: 3,220
- Average SoF: 1,487
| # |
groupid |
Driver |
Points |
| 1 |
180911 |
Josh Lowder |
171 |
| 2 |
128939 |
Casey Kelley |
160 |
| 3 |
330253 |
Richard D. Thomas |
160 |
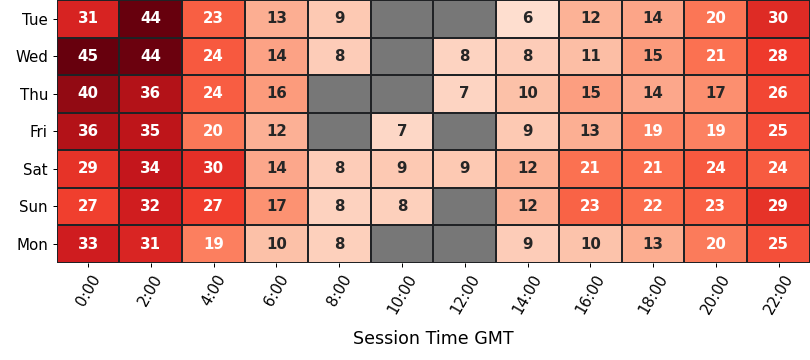
Historical Participation
Participation
average number of drivers in each time slot
Strength of Field
average SoF of the top split for each time slot
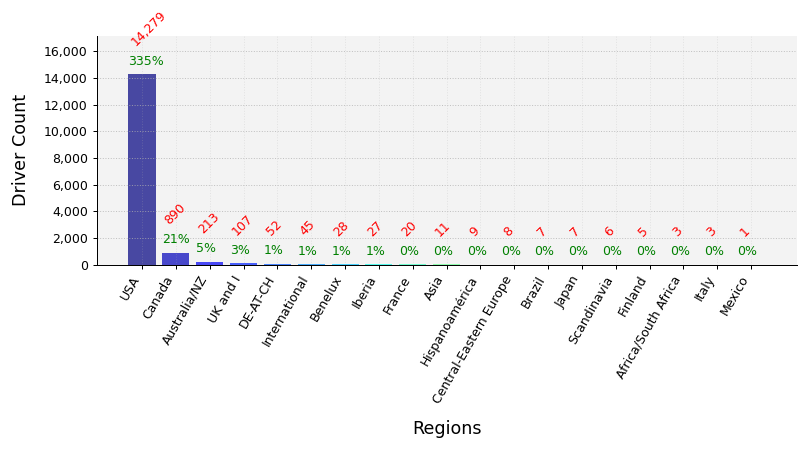
Clubs Distribution
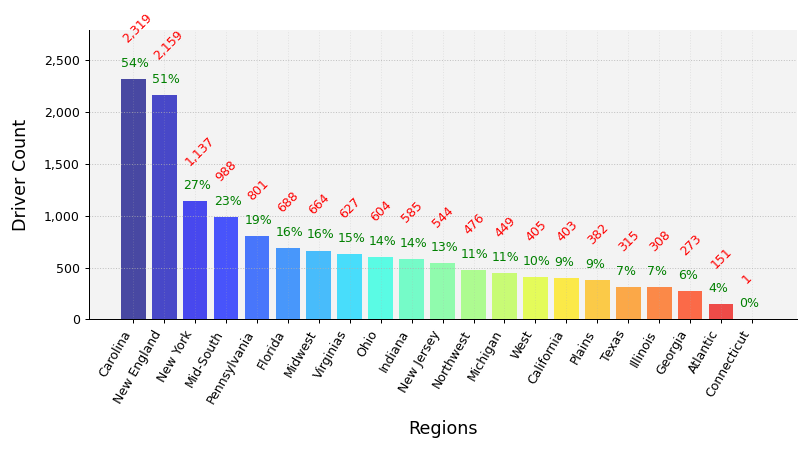
USA Clubs Distribution
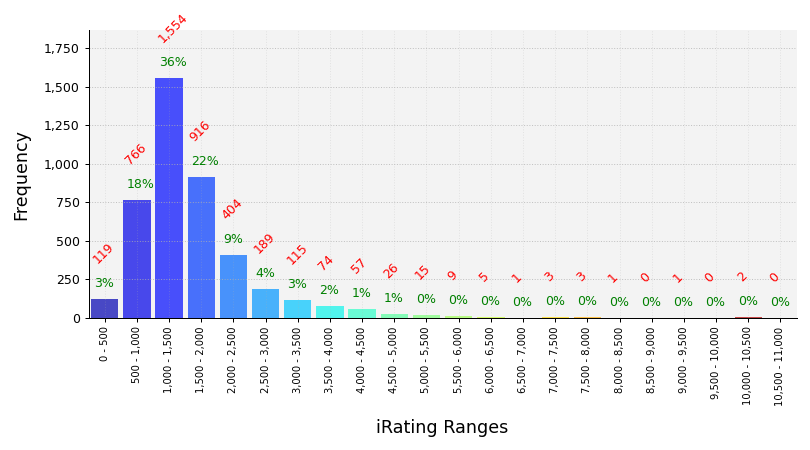
iRating Distribution
Championship Points
| # |
groupid |
Driver |
Points |
| 1 |
318658 |
Kyle Edgar |
1,293 |
| 2 |
75290 |
Ryan Lutz |
1,159 |
| 3 |
619791 |
Cameron Billings |
1,145 |
| 4 |
54614 |
Bryan Narducci |
1,104 |
| 5 |
446591 |
Jonathan Tuckness |
967 |
Most Race Starts
| # |
groupid |
Driver |
Starts |
| 1 |
633609 |
Anthony Scott4 |
88 |
| 2 |
434300 |
William Scott8 |
72 |
| 3 |
658186 |
Nathaniel Williams |
72 |
| 4 |
619791 |
Cameron Billings |
70 |
| 5 |
606210 |
Brandon Hughes7 |
64 |
Grand Chelems
pole position, won race, fastest lap, led every lap (perfect if 0 inc)
| # |
groupid |
Driver |
Grand Chelems |
Chelem % |
Perfects |
| 1 |
33988 |
Justin Brooks |
45 |
71% |
43 |
| 2 |
74163 |
Justin Brooks II |
32 |
86% |
26 |
| 3 |
619791 |
Cameron Billings |
11 |
16% |
7 |
| 4 |
582017 |
Mitch Drewnowski |
10 |
37% |
10 |
| 5 |
180911 |
Josh Lowder |
10 |
53% |
9 |
Average Finish Position
drivers must have raced 8 or more weeks to feature in this table
| # |
groupid |
Driver |
Avg Finish Pos |
Races |
| 1 |
270150 |
Nicholas Beekman |
2.6 |
8 |
| 2 |
318658 |
Kyle Edgar |
2.9 |
17 |
| 3 |
650065 |
Kevin Boylan |
3.1 |
16 |
| 4 |
559250 |
Chris Peters3 |
3.2 |
18 |
| 5 |
446591 |
Jonathan Tuckness |
3.6 |
49 |
Most Wins
| # |
groupid |
Driver |
Wins |
| 1 |
33988 |
Justin Brooks |
57 |
| 2 |
74163 |
Justin Brooks II |
35 |
| 3 |
619791 |
Cameron Billings |
25 |
| 4 |
446591 |
Jonathan Tuckness |
22 |
| 5 |
180911 |
Josh Lowder |
17 |
Most Podiums
| # |
groupid |
Driver |
Podiums |
| 1 |
33988 |
Justin Brooks |
59 |
| 2 |
619791 |
Cameron Billings |
46 |
| 3 |
74163 |
Justin Brooks II |
36 |
| 4 |
446591 |
Jonathan Tuckness |
34 |
| 5 |
556648 |
Tom Scully |
27 |
Most Poles
| # |
groupid |
Driver |
Poles |
| 1 |
33988 |
Justin Brooks |
60 |
| 2 |
74163 |
Justin Brooks II |
35 |
| 3 |
446591 |
Jonathan Tuckness |
23 |
| 4 |
619791 |
Cameron Billings |
21 |
| 5 |
665508 |
Parker Berndt |
16 |
Best Win Percentage
drivers must have raced 8 or more weeks to feature in this table
| # |
groupid |
Driver |
Win % |
Races |
| 1 |
318658 |
Kyle Edgar |
76% |
17 |
| 2 |
446591 |
Jonathan Tuckness |
45% |
49 |
| 3 |
544171 |
Dylan Conner2 |
40% |
30 |
| 4 |
404096 |
Jason Overton |
40% |
15 |
| 5 |
559250 |
Chris Peters3 |
39% |
18 |
Best Podium Percentage
drivers must have raced 8 or more weeks to feature in this table
| # |
groupid |
Driver |
Podium % |
Races |
| 1 |
270150 |
Nicholas Beekman |
88% |
8 |
| 2 |
318658 |
Kyle Edgar |
82% |
17 |
| 3 |
446591 |
Jonathan Tuckness |
69% |
49 |
| 4 |
650065 |
Kevin Boylan |
69% |
16 |
| 5 |
619791 |
Cameron Billings |
66% |
70 |
Best Pole Percentage
drivers must have raced 8 or more weeks to feature in this table
| # |
groupid |
Driver |
Pole % |
Races |
| 1 |
318658 |
Kyle Edgar |
65% |
17 |
| 2 |
446591 |
Jonathan Tuckness |
47% |
49 |
| 3 |
665508 |
Parker Berndt |
44% |
36 |
| 4 |
404096 |
Jason Overton |
40% |
15 |
| 5 |
559250 |
Chris Peters3 |
39% |
18 |
Best Average iRating Gains
drivers must have raced 8 or more weeks to feature in this table
| # |
groupid |
Team |
Avg iRating +/- |
Races |
| 1 |
472576 |
Nick Galusha |
43 |
19 |
| 2 |
614831 |
Dustin Hicks2 |
31 |
12 |
| 3 |
270150 |
Nicholas Beekman |
30 |
8 |
| 4 |
62585 |
Craig Weagle |
29 |
11 |
| 5 |
663133 |
Michael Flannery |
28 |
11 |
Highest Total iRating Gains
| # |
groupid |
Team |
iRating +/- |
Races |
| 1 |
619791 |
Cameron Billings |
1,640 |
70 |
| 2 |
472576 |
Nick Galusha |
821 |
19 |
| 3 |
181908 |
Brandon M Short |
788 |
14 |
| 4 |
601453 |
Cole Howard |
766 |
20 |
| 5 |
219715 |
Sam King |
732 |
13 |
Cleanest Drivers
drivers must have raced 8 or more weeks to feature in this table
| # |
groupid |
Team |
Inc / Corner |
Races |
| 1 |
487694 |
Bill Fouse |
0.007 |
8 |
| 2 |
517847 |
James Dallaire |
0.008 |
12 |
| 3 |
493582 |
Brandon Johnson21 |
0.010 |
10 |
| 4 |
550561 |
Patrick Ross2 |
0.011 |
12 |
| 5 |
481389 |
Mike Harris2 |
0.011 |
12 |