NASCAR Tour Modified Series - Fixed
2021 Season 4
- 2,708 unique drivers averaging 2.64 starts each.
- 49 drivers raced in 8 or more weeks.
- 563 official races with an average SOF of 1,717.
- 278,278 laps were completed with 35,037 incidents.
Week 1
Stafford Motor Speedway
Full Course
- Total official races: 32
- Total drivers: 388
- Unique drivers: 279
- Highest SoF: 2,688
- Average SoF: 1,825
| # |
groupid |
Driver |
Points |
| 1 |
79897 |
Mike Christopher Jr |
155 |
| 2 |
314277 |
Marcus Fruchtenicht |
142 |
| 3 |
171664 |
Thomas Axsom |
129 |
Week 2
Hickory Motor Speedway
- Total official races: 30
- Total drivers: 323
- Unique drivers: 232
- Highest SoF: 3,208
- Average SoF: 2,054
| # |
groupid |
Driver |
Points |
| 1 |
314277 |
Marcus Fruchtenicht |
185 |
| 2 |
75290 |
Ryan Lutz |
170 |
| 3 |
79897 |
Mike Christopher Jr |
165 |
Week 3
Myrtle Beach Speedway
- Total official races: 31
- Total drivers: 363
- Unique drivers: 274
- Highest SoF: 3,294
- Average SoF: 1,873
| # |
groupid |
Driver |
Points |
| 1 |
318658 |
Kyle Edgar |
182 |
| 2 |
75290 |
Ryan Lutz |
163 |
| 3 |
54614 |
Bryan Narducci |
145 |
Week 4
USA International Speedway
Asphalt
- Total official races: 64
- Total drivers: 815
- Unique drivers: 562
- Highest SoF: 2,754
- Average SoF: 1,681
| # |
groupid |
Driver |
Points |
| 1 |
425942 |
Kaleb Hall |
162 |
| 2 |
648813 |
Kevin Smith26 |
161 |
| 3 |
36366 |
Michael Cooper2 |
153 |
Week 5
Irwindale Speedway
Outer
- Total official races: 22
- Total drivers: 257
- Unique drivers: 196
- Highest SoF: 2,569
- Average SoF: 1,781
| # |
groupid |
Driver |
Points |
| 1 |
18144 |
Brad Wright |
139 |
| 2 |
582017 |
Mitch Drewnowski |
139 |
| 3 |
165147 |
Ryan Gavel |
136 |
Week 6
New Smyrna Speedway
- Total official races: 34
- Total drivers: 398
- Unique drivers: 288
- Highest SoF: 2,914
- Average SoF: 1,731
| # |
groupid |
Driver |
Points |
| 1 |
338108 |
Aaron Plemons |
165 |
| 2 |
75290 |
Ryan Lutz |
150 |
| 3 |
222356 |
Jean-Philippe Bergeron |
141 |
Week 7
[Legacy] Phoenix Raceway - 2008
Oval
- Total official races: 89
- Total drivers: 1,241
- Unique drivers: 717
- Highest SoF: 3,292
- Average SoF: 1,549
| # |
groupid |
Driver |
Points |
| 1 |
349924 |
Matt S Sanders |
190 |
| 2 |
218137 |
Merrick Watchorn |
176 |
| 3 |
79897 |
Mike Christopher Jr |
162 |
Week 8
Martinsville Speedway
- Total official races: 57
- Total drivers: 776
- Unique drivers: 558
- Highest SoF: 3,738
- Average SoF: 1,733
| # |
groupid |
Driver |
Points |
| 1 |
79897 |
Mike Christopher Jr |
217 |
| 2 |
314277 |
Marcus Fruchtenicht |
203 |
| 3 |
582017 |
Mitch Drewnowski |
189 |
Week 9
South Boston Speedway
- Total official races: 52
- Total drivers: 652
- Unique drivers: 436
- Highest SoF: 3,038
- Average SoF: 1,757
| # |
groupid |
Driver |
Points |
| 1 |
75290 |
Ryan Lutz |
174 |
| 2 |
582017 |
Mitch Drewnowski |
159 |
| 3 |
43964 |
Mitchell Drewnowski |
146 |
Week 10
North Wilkesboro Speedway
1987
- Total official races: 44
- Total drivers: 534
- Unique drivers: 359
- Highest SoF: 3,463
- Average SoF: 1,741
| # |
groupid |
Driver |
Points |
| 1 |
218582 |
Ethan Johnson |
190 |
| 2 |
256344 |
Ryan A Blanchard |
163 |
| 3 |
75290 |
Ryan Lutz |
160 |
Week 11
Iowa Speedway
Oval
- Total official races: 69
- Total drivers: 936
- Unique drivers: 575
- Highest SoF: 2,860
- Average SoF: 1,655
| # |
groupid |
Driver |
Points |
| 1 |
33988 |
Justin Brooks |
158 |
| 2 |
540005 |
Austin S Hill |
155 |
| 3 |
538598 |
Blake Giglio |
154 |
Week 12
Nashville Fairgrounds Speedway
Oval
- Total official races: 39
- Total drivers: 467
- Unique drivers: 347
- Highest SoF: 2,473
- Average SoF: 1,652
| # |
groupid |
Driver |
Points |
| 1 |
318658 |
Kyle Edgar |
146 |
| 2 |
180911 |
Josh Lowder |
141 |
| 3 |
33628 |
Paul Kusheba |
135 |
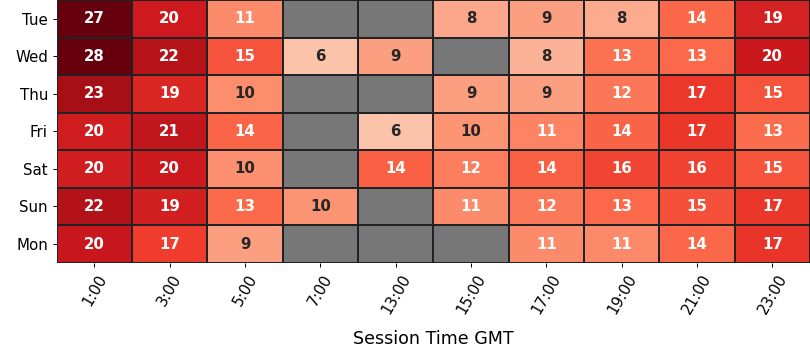
Historical Participation
Participation
average number of drivers in each time slot
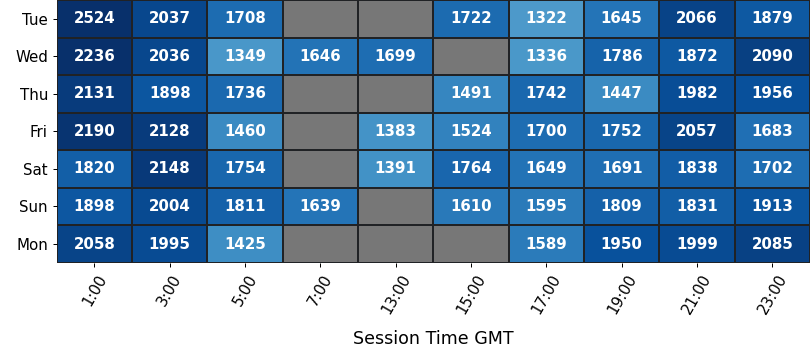
Strength of Field
average SoF of the top split for each time slot
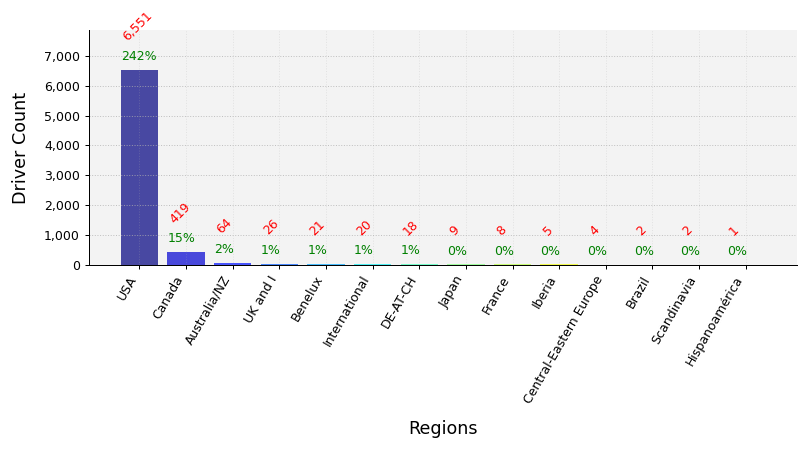
Clubs Distribution
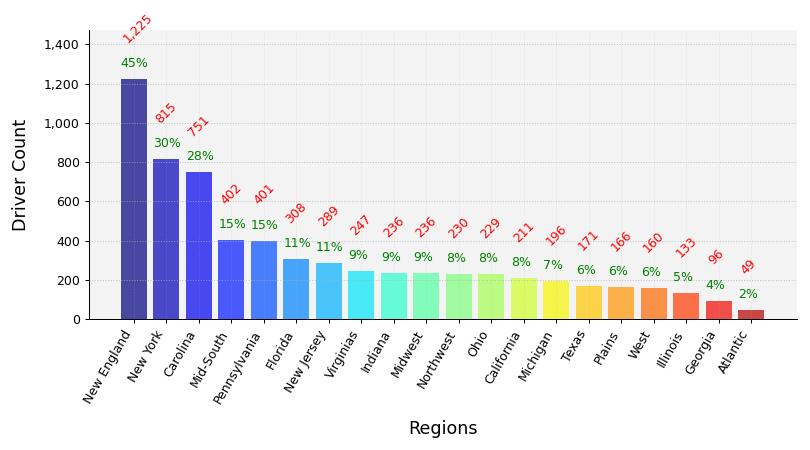
USA Clubs Distribution
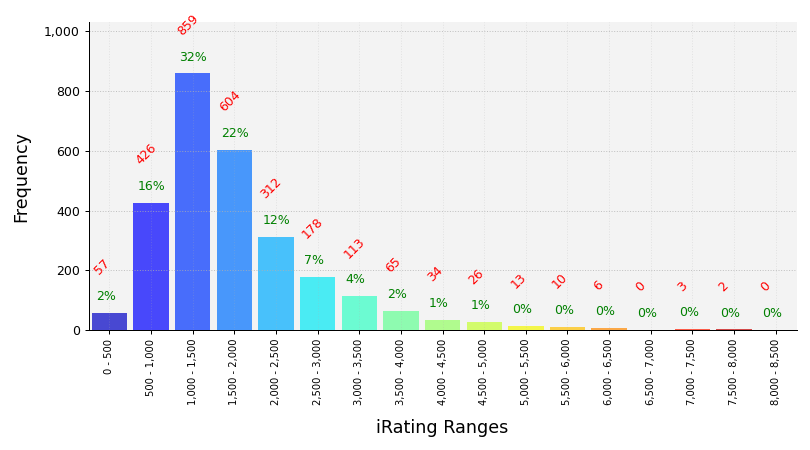
iRating Distribution
Championship Points
| # |
groupid |
Driver |
Points |
| 1 |
75290 |
Ryan Lutz |
1,243 |
| 2 |
582017 |
Mitch Drewnowski |
1,180 |
| 3 |
54614 |
Bryan Narducci |
1,096 |
| 4 |
79897 |
Mike Christopher Jr |
1,019 |
| 5 |
335931 |
Greg Freeman |
1,017 |
Most Race Starts
| # |
groupid |
Driver |
Starts |
| 1 |
541885 |
Tracy Pedder |
129 |
| 2 |
335931 |
Greg Freeman |
85 |
| 3 |
582017 |
Mitch Drewnowski |
57 |
| 4 |
653282 |
Michael Krey |
52 |
| 5 |
54614 |
Bryan Narducci |
37 |
Grand Chelems
pole position, won race, fastest lap, led every lap (perfect if 0 inc)
| # |
groupid |
Driver |
Grand Chelems |
Chelem % |
Perfects |
| 1 |
582017 |
Mitch Drewnowski |
18 |
32% |
16 |
| 2 |
335931 |
Greg Freeman |
7 |
8% |
6 |
| 3 |
687344 |
Amy Smith6 |
6 |
40% |
5 |
| 4 |
446591 |
Jonathan Tuckness |
4 |
12% |
3 |
| 5 |
110893 |
Kyle B Scisco |
3 |
75% |
3 |
Average Finish Position
drivers must have raced 8 or more weeks to feature in this table
| # |
groupid |
Driver |
Avg Finish Pos |
Races |
| 1 |
582017 |
Mitch Drewnowski |
2.0 |
57 |
| 2 |
446591 |
Jonathan Tuckness |
3.5 |
32 |
| 3 |
504538 |
Luke G Baldwin |
3.5 |
21 |
| 4 |
462150 |
Andrew Charron |
3.7 |
13 |
| 5 |
525052 |
Ryan Grassie |
3.8 |
12 |
Most Wins
| # |
groupid |
Driver |
Wins |
| 1 |
582017 |
Mitch Drewnowski |
32 |
| 2 |
335931 |
Greg Freeman |
26 |
| 3 |
541885 |
Tracy Pedder |
26 |
| 4 |
446591 |
Jonathan Tuckness |
12 |
| 5 |
265931 |
Matt McGrath |
11 |
Most Podiums
| # |
groupid |
Driver |
Podiums |
| 1 |
541885 |
Tracy Pedder |
53 |
| 2 |
582017 |
Mitch Drewnowski |
50 |
| 3 |
335931 |
Greg Freeman |
49 |
| 4 |
446591 |
Jonathan Tuckness |
23 |
| 5 |
54614 |
Bryan Narducci |
21 |
Most Poles
| # |
groupid |
Driver |
Poles |
| 1 |
582017 |
Mitch Drewnowski |
34 |
| 2 |
541885 |
Tracy Pedder |
23 |
| 3 |
265931 |
Matt McGrath |
12 |
| 4 |
335931 |
Greg Freeman |
11 |
| 5 |
446591 |
Jonathan Tuckness |
11 |
Best Win Percentage
drivers must have raced 8 or more weeks to feature in this table
| # |
groupid |
Driver |
Win % |
Races |
| 1 |
582017 |
Mitch Drewnowski |
56% |
57 |
| 2 |
462150 |
Andrew Charron |
46% |
13 |
| 3 |
265931 |
Matt McGrath |
39% |
28 |
| 4 |
446591 |
Jonathan Tuckness |
38% |
32 |
| 5 |
504538 |
Luke G Baldwin |
38% |
21 |
Best Podium Percentage
drivers must have raced 8 or more weeks to feature in this table
| # |
groupid |
Driver |
Podium % |
Races |
| 1 |
582017 |
Mitch Drewnowski |
88% |
57 |
| 2 |
504538 |
Luke G Baldwin |
76% |
21 |
| 3 |
446591 |
Jonathan Tuckness |
72% |
32 |
| 4 |
75290 |
Ryan Lutz |
67% |
21 |
| 5 |
538538 |
Evan M Roy |
60% |
10 |
Best Pole Percentage
drivers must have raced 8 or more weeks to feature in this table
| # |
groupid |
Driver |
Pole % |
Races |
| 1 |
582017 |
Mitch Drewnowski |
60% |
57 |
| 2 |
504538 |
Luke G Baldwin |
48% |
21 |
| 3 |
265931 |
Matt McGrath |
43% |
28 |
| 4 |
446591 |
Jonathan Tuckness |
34% |
32 |
| 5 |
217262 |
Joseph John Braun |
33% |
9 |
Best Average iRating Gains
drivers must have raced 8 or more weeks to feature in this table
| # |
groupid |
Team |
Avg iRating +/- |
Races |
| 1 |
525052 |
Ryan Grassie |
36 |
12 |
| 2 |
538538 |
Evan M Roy |
34 |
10 |
| 3 |
258322 |
Andrew Hayn |
27 |
10 |
| 4 |
617805 |
Clement Downing |
25 |
9 |
| 5 |
405265 |
Shunsuke Teshima |
25 |
9 |
Highest Total iRating Gains
| # |
groupid |
Team |
iRating +/- |
Races |
| 1 |
541885 |
Tracy Pedder |
1,523 |
129 |
| 2 |
582017 |
Mitch Drewnowski |
1,079 |
57 |
| 3 |
335931 |
Greg Freeman |
810 |
85 |
| 4 |
672748 |
Casey Shepherd |
721 |
13 |
| 5 |
43964 |
Mitchell Drewnowski |
579 |
17 |
Cleanest Drivers
drivers must have raced 8 or more weeks to feature in this table
| # |
groupid |
Team |
Inc / Corner |
Races |
| 1 |
538538 |
Evan M Roy |
0.006 |
10 |
| 2 |
582017 |
Mitch Drewnowski |
0.014 |
57 |
| 3 |
518749 |
Brian Darbe |
0.016 |
12 |
| 4 |
527535 |
Scott Denney |
0.017 |
16 |
| 5 |
584714 |
Richard Yannetta |
0.018 |
11 |