World of Outlaws Late Model Series - Fixed
2021 Season 4
- 3,059 unique drivers averaging 3.58 starts each.
- 109 drivers raced in 8 or more weeks.
- 882 official races with an average SOF of 2,027.
- 267,534 laps were completed with 25,554 incidents.
Week 1
Volusia Speedway Park
- Total official races: 99
- Total drivers: 1,279
- Unique drivers: 720
- Highest SoF: 3,539
- Average SoF: 1,945
| # |
groupid |
Driver |
Points |
| 1 |
422059 |
Payton Talbot |
183 |
| 2 |
354657 |
Cayden Rush |
181 |
| 3 |
578634 |
Gauge Martinez |
179 |
Week 2
USA International Speedway
Dirt
- Total official races: 72
- Total drivers: 887
- Unique drivers: 600
- Highest SoF: 3,474
- Average SoF: 1,981
| # |
groupid |
Driver |
Points |
| 1 |
349924 |
Matt S Sanders |
200 |
| 2 |
505231 |
Devon Byrd |
180 |
| 3 |
412307 |
Joshua Kunstbeck |
175 |
Week 3
Lanier National Speedway
Dirt
- Total official races: 97
- Total drivers: 1,273
- Unique drivers: 763
- Highest SoF: 3,792
- Average SoF: 1,989
| # |
groupid |
Driver |
Points |
| 1 |
345821 |
Terry Barnett |
221 |
| 2 |
272748 |
Hunter Mccoy |
208 |
| 3 |
422059 |
Payton Talbot |
204 |
- Total official races: 93
- Total drivers: 2,417
- Unique drivers: 1,195
- Highest SoF: 4,078
- Average SoF: 2,040
| # |
groupid |
Driver |
Points |
| 1 |
270384 |
Shane James3 |
225 |
| 2 |
369202 |
Huey Quillen |
216 |
| 3 |
433071 |
Kaden Reynolds |
206 |
Week 5
Cedar Lake Speedway
- Total official races: 81
- Total drivers: 974
- Unique drivers: 575
- Highest SoF: 3,578
- Average SoF: 2,056
| # |
groupid |
Driver |
Points |
| 1 |
385017 |
Cameron Cason |
199 |
| 2 |
285297 |
Dezmond Busby |
193 |
| 3 |
118355 |
Austin Simpson |
187 |
- Total official races: 41
- Total drivers: 427
- Unique drivers: 317
- Highest SoF: 3,348
- Average SoF: 2,114
| # |
groupid |
Driver |
Points |
| 1 |
393653 |
Donnie Brown Jr |
180 |
| 2 |
442802 |
Robert Young4 |
162 |
| 3 |
365802 |
Adam Holbert |
162 |
- Total official races: 94
- Total drivers: 2,417
- Unique drivers: 1,195
- Highest SoF: 3,880
- Average SoF: 2,036
| # |
groupid |
Driver |
Points |
| 1 |
295661 |
Christopher McGuire |
218 |
| 2 |
422059 |
Payton Talbot |
206 |
| 3 |
628490 |
Félix F. Roy |
202 |
Week 8
Limaland Motorsports Park
- Total official races: 59
- Total drivers: 687
- Unique drivers: 482
- Highest SoF: 3,488
- Average SoF: 1,973
| # |
groupid |
Driver |
Points |
| 1 |
295661 |
Christopher McGuire |
191 |
| 2 |
261989 |
Tyler D. Hudson |
178 |
| 3 |
424352 |
Chase Hardy |
171 |
Week 9
Weedsport Speedway
- Total official races: 31
- Total drivers: 353
- Unique drivers: 238
- Highest SoF: 3,493
- Average SoF: 2,212
| # |
groupid |
Driver |
Points |
| 1 |
269643 |
Jesse Enterkin |
176 |
| 2 |
559250 |
Chris Peters3 |
170 |
| 3 |
61016 |
Cole Exum |
169 |
Week 10
Lernerville Speedway
- Total official races: 69
- Total drivers: 852
- Unique drivers: 520
- Highest SoF: 3,881
- Average SoF: 2,088
| # |
groupid |
Driver |
Points |
| 1 |
295661 |
Christopher McGuire |
215 |
| 2 |
517428 |
Austin Hunter7 |
202 |
| 3 |
684588 |
Aaron M Langley |
197 |
Week 11
Williams Grove Speedway
- Total official races: 54
- Total drivers: 597
- Unique drivers: 370
- Highest SoF: 3,357
- Average SoF: 2,105
| # |
groupid |
Driver |
Points |
| 1 |
389740 |
Chance Carr |
176 |
| 2 |
295661 |
Christopher McGuire |
166 |
| 3 |
374481 |
Brent D Carter |
163 |
Week 12
The Dirt Track at Charlotte
- Total official races: 92
- Total drivers: 1,190
- Unique drivers: 697
- Highest SoF: 3,856
- Average SoF: 1,989
| # |
groupid |
Driver |
Points |
| 1 |
281939 |
Ryan A Underwwod |
218 |
| 2 |
416291 |
Camden Johnston |
202 |
| 3 |
295661 |
Christopher McGuire |
196 |
Historical Participation
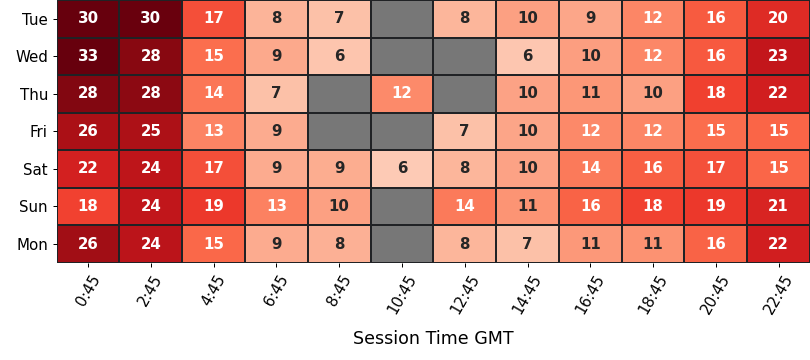
Participation
average number of drivers in each time slot
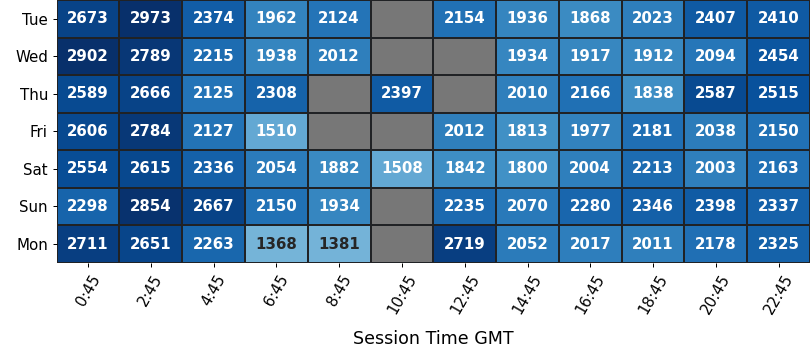
Strength of Field
average SoF of the top split for each time slot
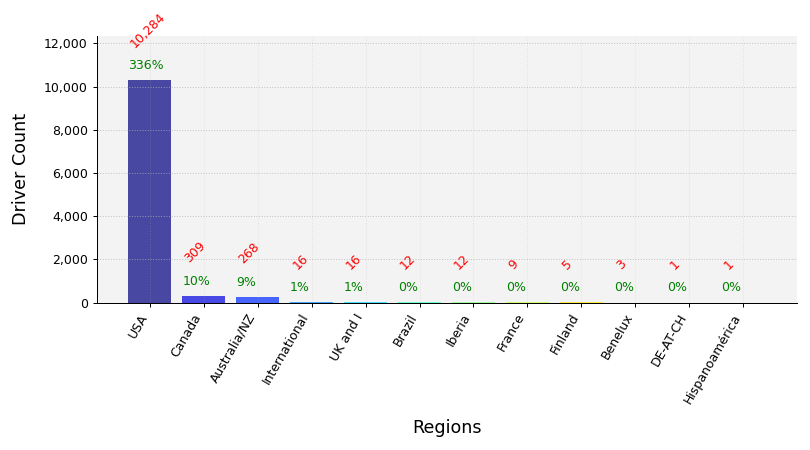
Clubs Distribution
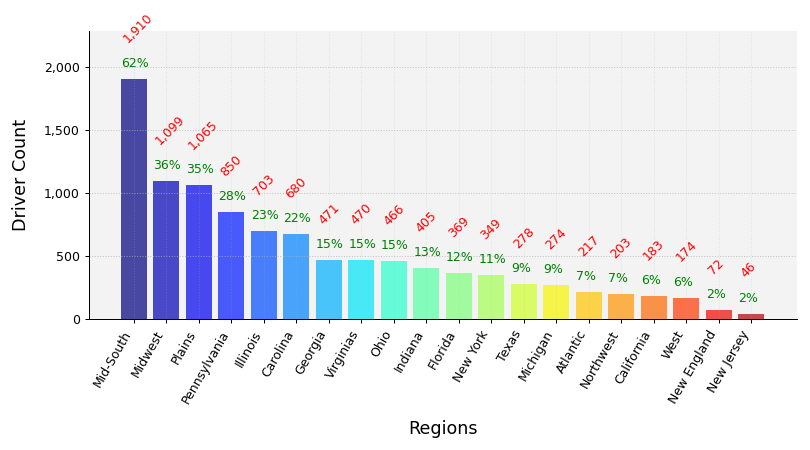
USA Clubs Distribution
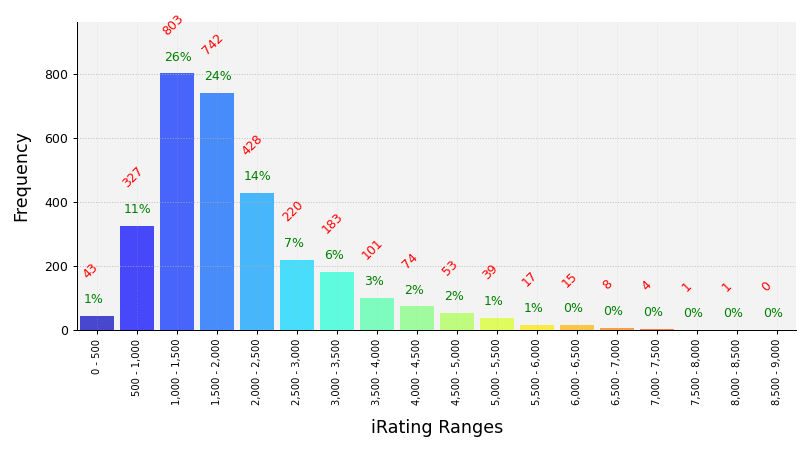
iRating Distribution
Championship Points
| # |
groupid |
Driver |
Points |
| 1 |
295661 |
Christopher McGuire |
1,542 |
| 2 |
349924 |
Matt S Sanders |
1,375 |
| 3 |
367900 |
Nathan Culpepper |
1,248 |
| 4 |
365802 |
Adam Holbert |
1,237 |
| 5 |
385792 |
Robert Tucker2 |
1,226 |
Most Race Starts
| # |
groupid |
Driver |
Starts |
| 1 |
515448 |
Ken Brown |
184 |
| 2 |
559250 |
Chris Peters3 |
80 |
| 3 |
383357 |
Ryan Clatterbuck |
76 |
| 4 |
367900 |
Nathan Culpepper |
64 |
| 5 |
475954 |
Timothy Prelog |
61 |
Grand Chelems
pole position, won race, fastest lap, led every lap (perfect if 0 inc)
| # |
groupid |
Driver |
Grand Chelems |
Chelem % |
Perfects |
| 1 |
559250 |
Chris Peters3 |
17 |
21% |
15 |
| 2 |
295661 |
Christopher McGuire |
13 |
38% |
13 |
| 3 |
23734 |
Justin Norwood |
7 |
78% |
7 |
| 4 |
365802 |
Adam Holbert |
7 |
35% |
6 |
| 5 |
429209 |
Tyler Kinsey |
6 |
29% |
5 |
Average Finish Position
drivers must have raced 8 or more weeks to feature in this table
| # |
groupid |
Driver |
Avg Finish Pos |
Races |
| 1 |
365802 |
Adam Holbert |
1.3 |
20 |
| 2 |
269643 |
Jesse Enterkin |
1.5 |
16 |
| 3 |
270384 |
Shane James3 |
1.7 |
9 |
| 4 |
295661 |
Christopher McGuire |
1.8 |
34 |
| 5 |
269186 |
Seth Gibbs |
2.5 |
13 |
Most Wins
| # |
groupid |
Driver |
Wins |
| 1 |
559250 |
Chris Peters3 |
36 |
| 2 |
295661 |
Christopher McGuire |
29 |
| 3 |
365802 |
Adam Holbert |
16 |
| 4 |
444617 |
Eric Roberts5 |
13 |
| 5 |
429209 |
Tyler Kinsey |
12 |
Most Podiums
| # |
groupid |
Driver |
Podiums |
| 1 |
559250 |
Chris Peters3 |
63 |
| 2 |
515448 |
Ken Brown |
58 |
| 3 |
367900 |
Nathan Culpepper |
45 |
| 4 |
295661 |
Christopher McGuire |
31 |
| 5 |
413405 |
Jacob Todd |
29 |
Most Poles
| # |
groupid |
Driver |
Poles |
| 1 |
559250 |
Chris Peters3 |
28 |
| 2 |
295661 |
Christopher McGuire |
18 |
| 3 |
367900 |
Nathan Culpepper |
17 |
| 4 |
429209 |
Tyler Kinsey |
15 |
| 5 |
269643 |
Jesse Enterkin |
13 |
Best Win Percentage
drivers must have raced 8 or more weeks to feature in this table
| # |
groupid |
Driver |
Win % |
Races |
| 1 |
295661 |
Christopher McGuire |
85% |
34 |
| 2 |
365802 |
Adam Holbert |
80% |
20 |
| 3 |
269643 |
Jesse Enterkin |
62% |
16 |
| 4 |
269186 |
Seth Gibbs |
62% |
13 |
| 5 |
429209 |
Tyler Kinsey |
57% |
21 |
Best Podium Percentage
drivers must have raced 8 or more weeks to feature in this table
| # |
groupid |
Driver |
Podium % |
Races |
| 1 |
365802 |
Adam Holbert |
100% |
20 |
| 2 |
269643 |
Jesse Enterkin |
100% |
16 |
| 3 |
270384 |
Shane James3 |
100% |
9 |
| 4 |
295661 |
Christopher McGuire |
91% |
34 |
| 5 |
385792 |
Robert Tucker2 |
81% |
26 |
Best Pole Percentage
drivers must have raced 8 or more weeks to feature in this table
| # |
groupid |
Driver |
Pole % |
Races |
| 1 |
269643 |
Jesse Enterkin |
81% |
16 |
| 2 |
270384 |
Shane James3 |
78% |
9 |
| 3 |
429209 |
Tyler Kinsey |
71% |
21 |
| 4 |
349924 |
Matt S Sanders |
65% |
17 |
| 5 |
365802 |
Adam Holbert |
60% |
20 |
Best Average iRating Gains
drivers must have raced 8 or more weeks to feature in this table
| # |
groupid |
Team |
Avg iRating +/- |
Races |
| 1 |
95347 |
Dustin Pegher |
48 |
23 |
| 2 |
635327 |
Michael Grinstead2 |
39 |
10 |
| 3 |
487997 |
Wade Patterson |
35 |
14 |
| 4 |
385792 |
Robert Tucker2 |
32 |
26 |
| 5 |
523588 |
Brian Schanz |
30 |
18 |
Highest Total iRating Gains
| # |
groupid |
Team |
iRating +/- |
Races |
| 1 |
515448 |
Ken Brown |
2,137 |
184 |
| 2 |
344962 |
Chris Marchant |
1,292 |
50 |
| 3 |
372410 |
Jake Goetze |
1,233 |
44 |
| 4 |
95347 |
Dustin Pegher |
1,108 |
23 |
| 5 |
507352 |
Richard Caneff |
970 |
54 |
Cleanest Drivers
drivers must have raced 8 or more weeks to feature in this table
| # |
groupid |
Team |
Inc / Corner |
Races |
| 1 |
429209 |
Tyler Kinsey |
0.002 |
21 |
| 2 |
270384 |
Shane James3 |
0.003 |
9 |
| 3 |
336204 |
Mark Scott |
0.004 |
10 |
| 4 |
269643 |
Jesse Enterkin |
0.005 |
16 |
| 5 |
423436 |
Donald Turbeville |
0.005 |
19 |