All special events a team has participated in: start/finish positions in class, per-driver fastest laps, and career lap totals.
Per-car lap-time comparison (fastest, median, spread) for a single special event, with supporting win / podium / finish stats.
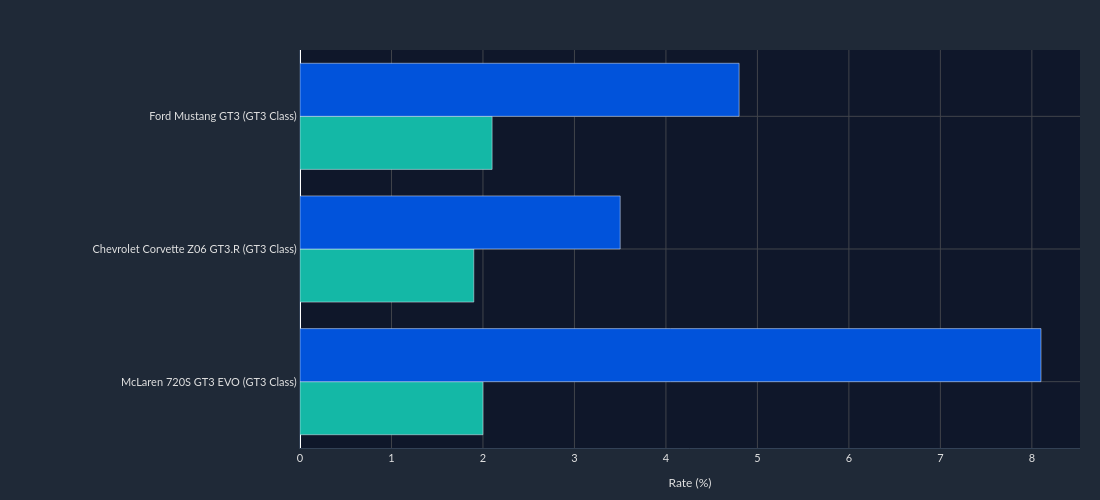
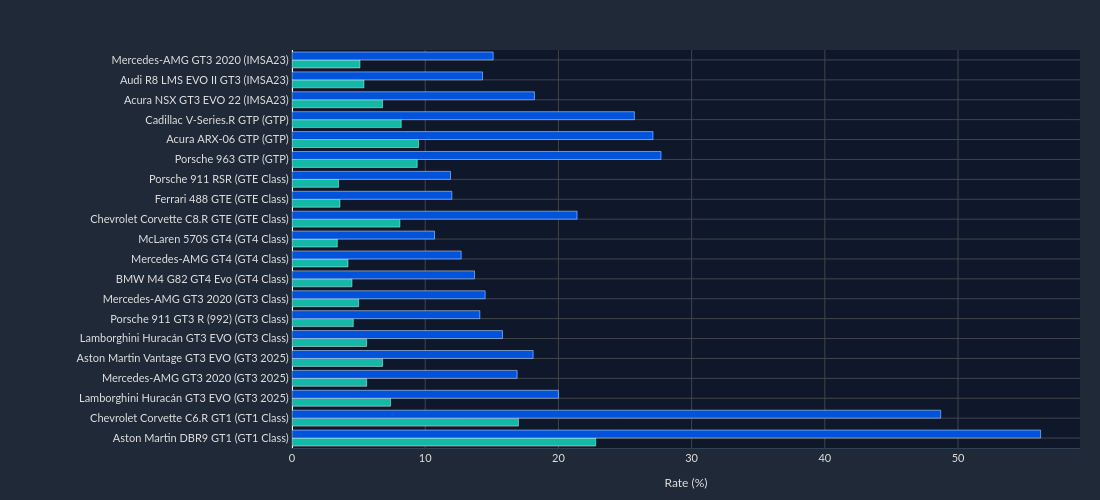
Car performance rankings within multimake classes, showing which cars produce the best average finishes, win rates, and podium rates.
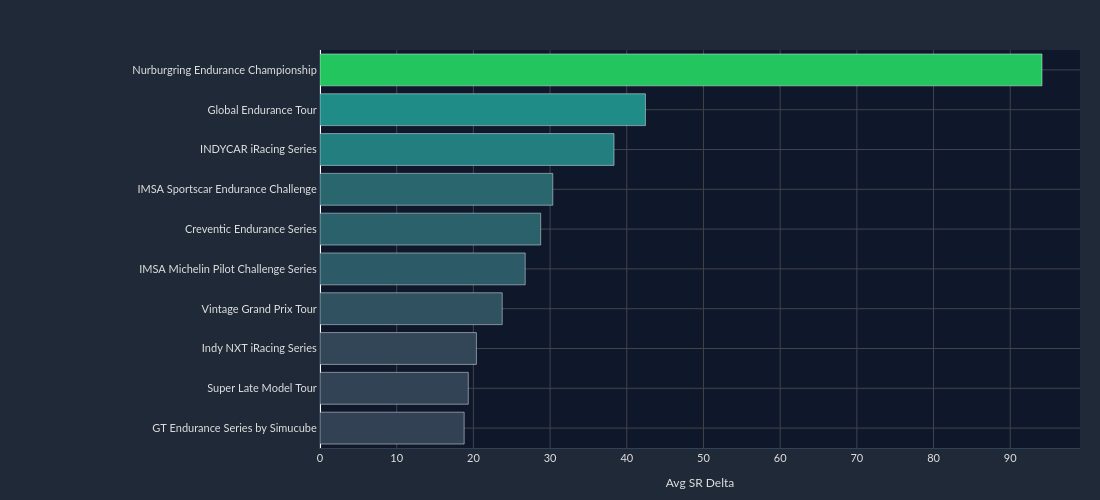
Series rankings by Safety Rating improvement metrics per license level, including average SR delta, positive rate, and cleanliness.
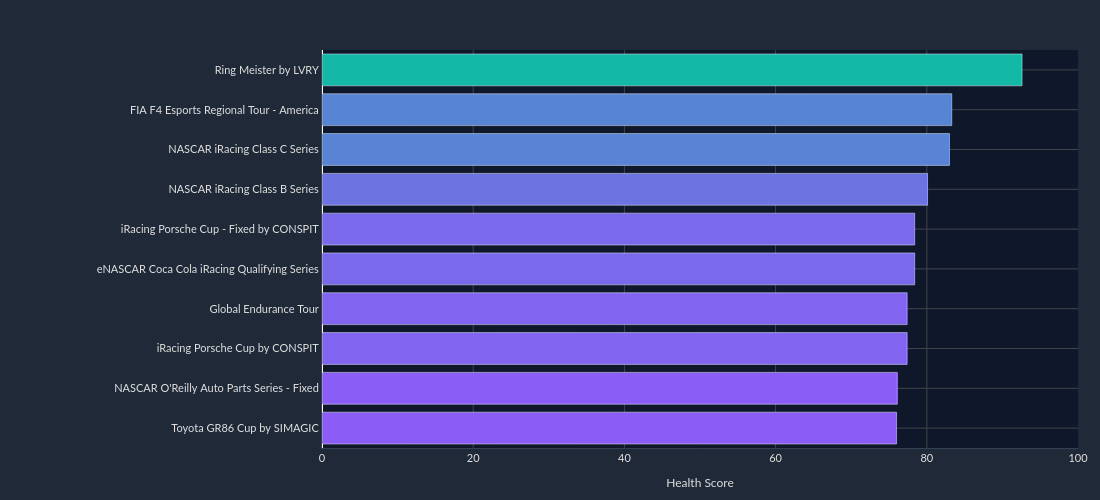
Health scorecard for each series based on participation trends, field sizes, split counts, and driver retention with composite scoring.
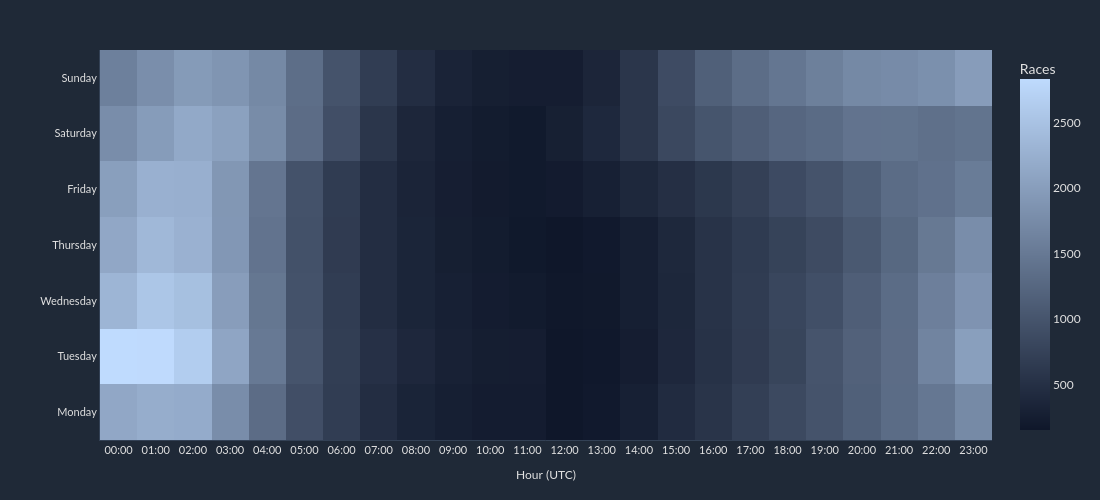
When iRacing is most active by day of week and time of day, with heatmaps showing race counts and field sizes by category and series.
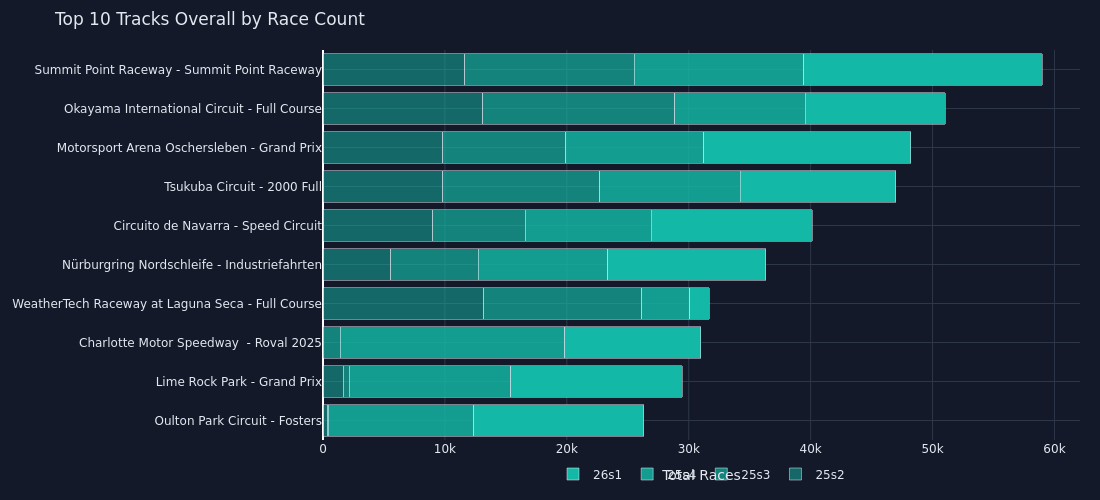
Track popularity rankings by race count, unique drivers, and average field size with per-category breakdowns.
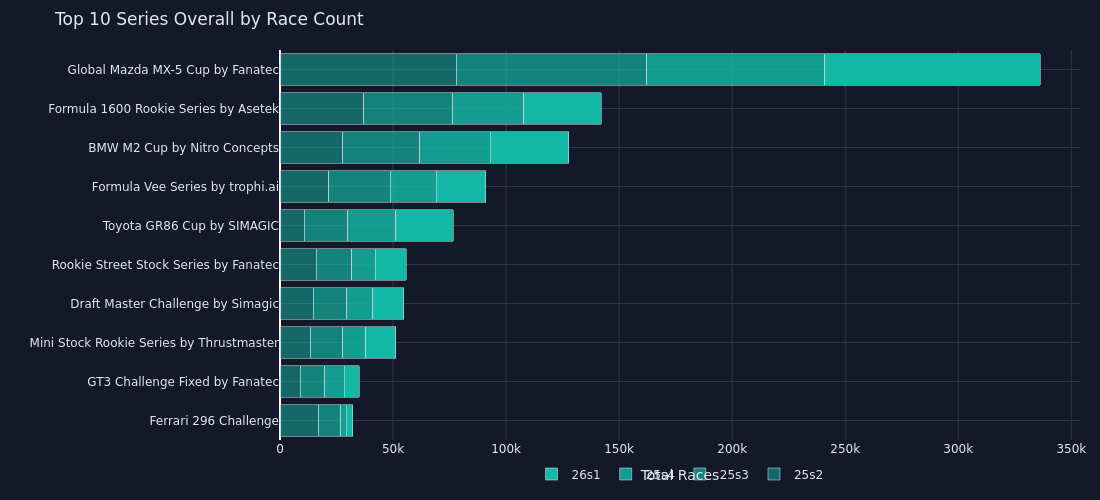
Series popularity rankings by race count, unique drivers, and average field size with per-category breakdowns.
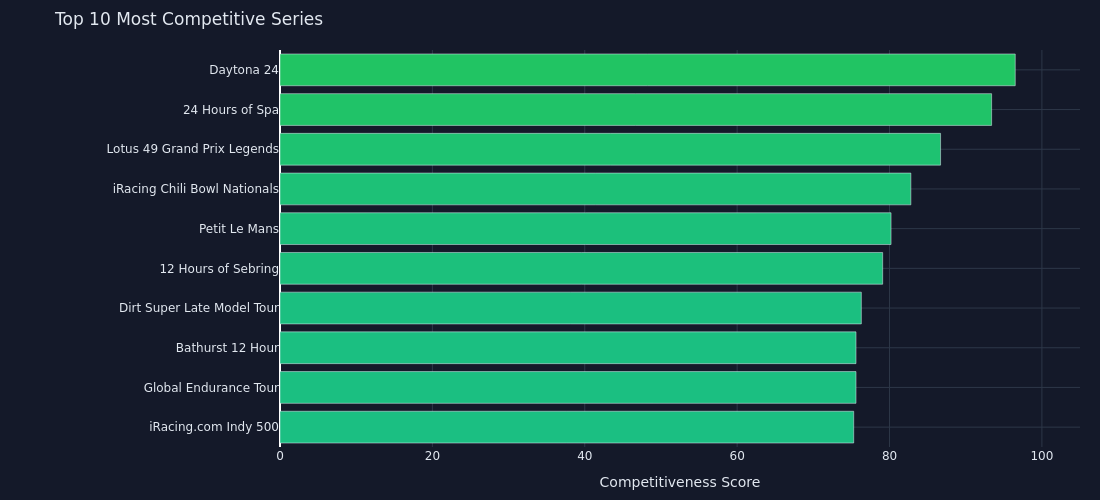
Series and track competitiveness rankings by lead changes, finish interval tightness, and strength of field.
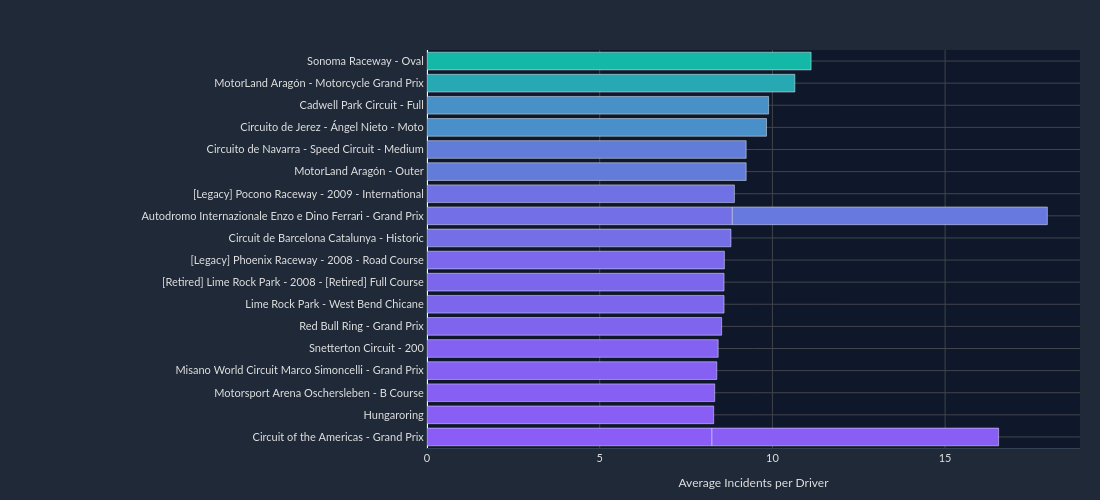
Track rankings by average incident rate with normalized metrics, trend analysis, and per-category breakdowns.